

![]()
![]()
Benchmark allows you to easily create sophisticated Swift performance benchmarks
Performance is a key feature for many apps and frameworks. Benchmark helps make it easy to measure and track many different metrics that affects performance, such as CPU usage, ARC traffic, memory/malloc usage and use of operating system resources such as threads and system calls, as well as completely custom metric counters.
Benchmark works on both macOS and Linux and supports several key workflows for performance measurements:
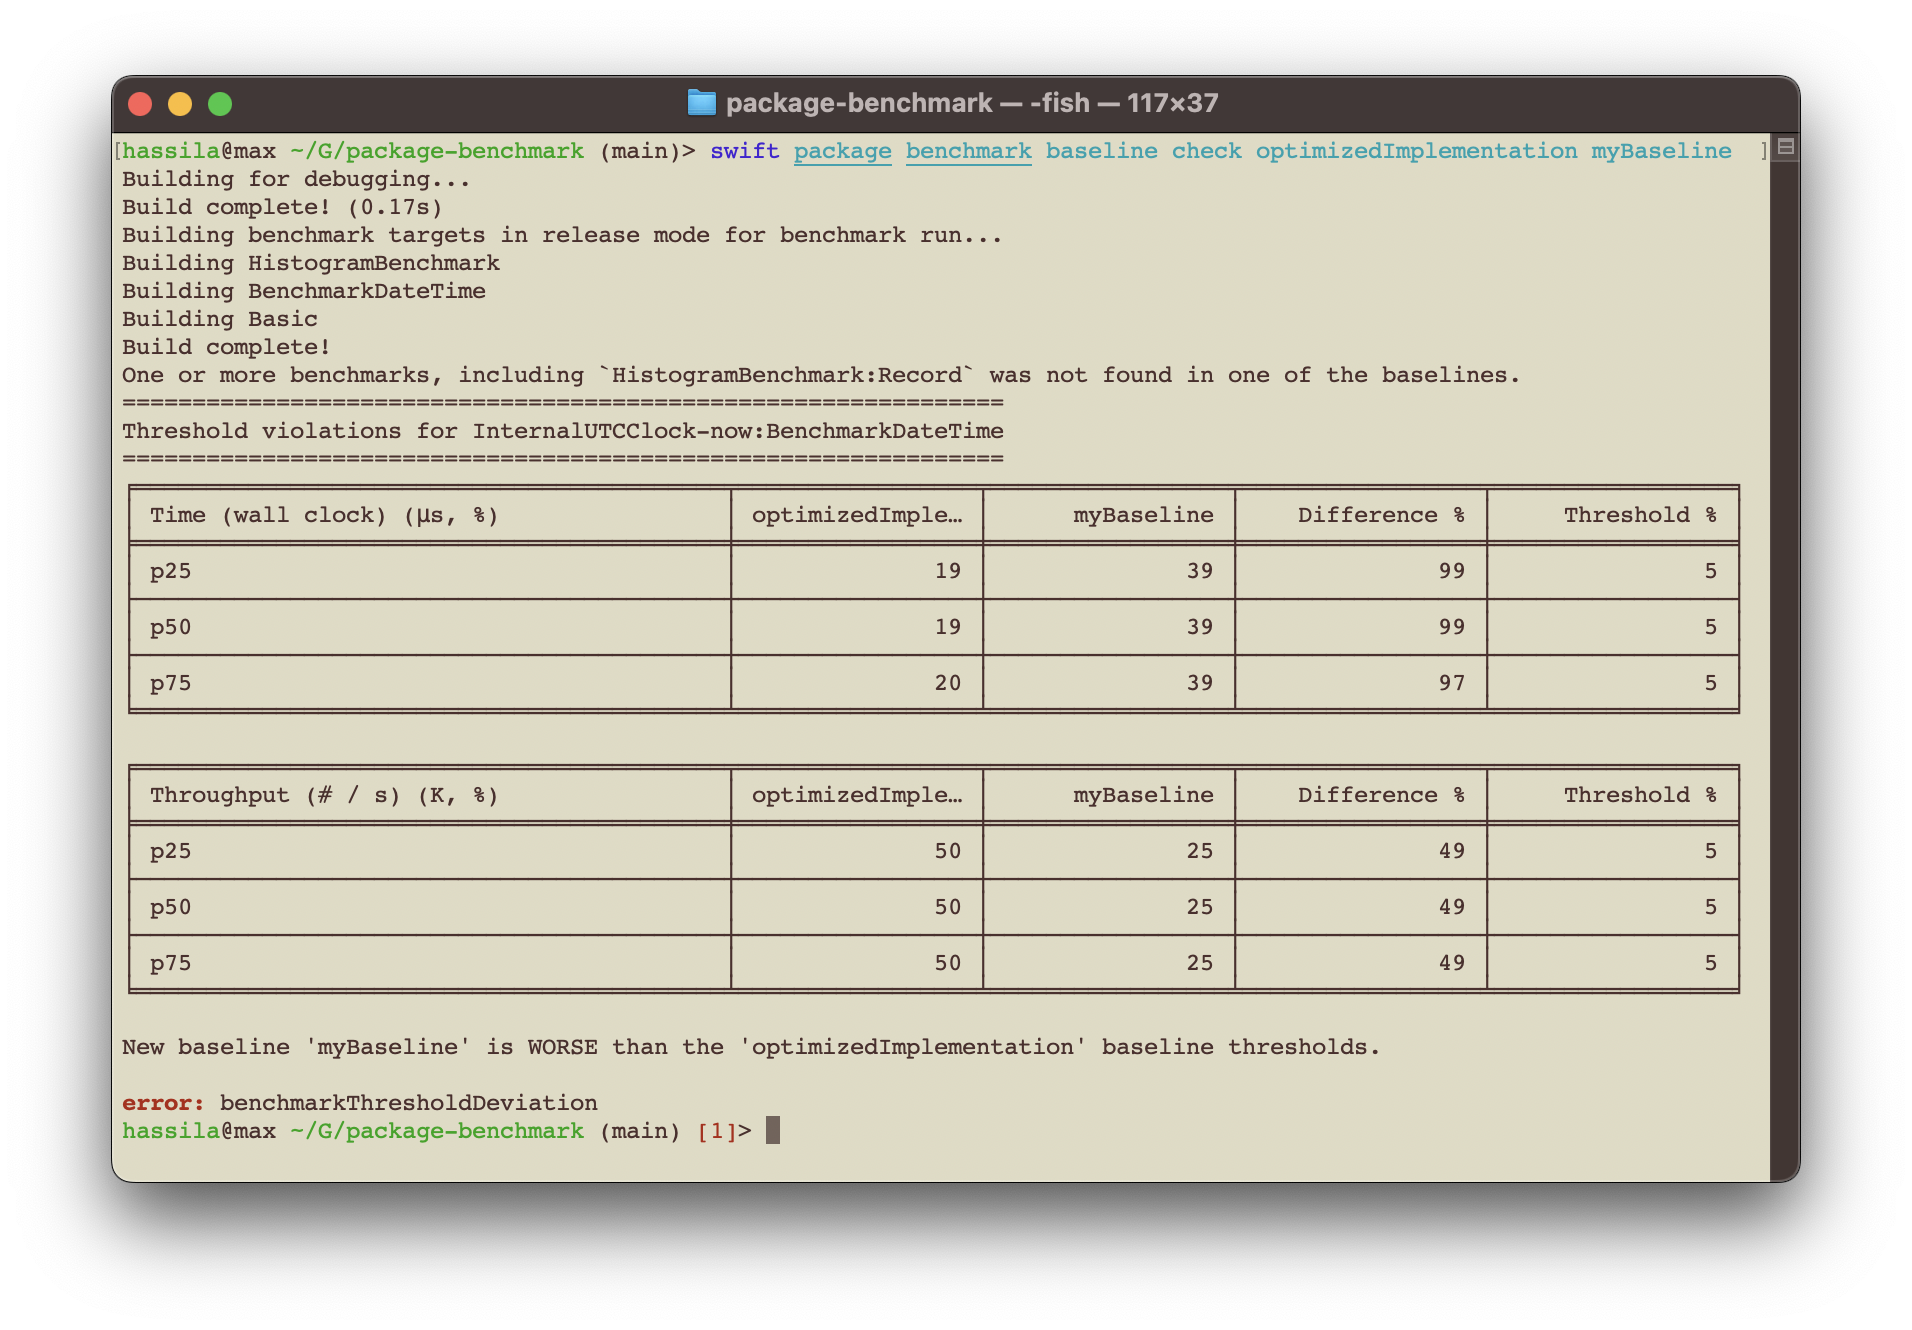
- Automated Pull Request performance regression checks by comparing the performance metrics of a pull request with the main branch and having the PR workflow check fail if there is a regression according to absolute or relative thresholds specified per benchmark
- Manual comparison of multiple performance baselines for iterative or A/B performance work by an individual developer
- Export of benchmark results in several formats for analysis or visualization
Benchmark provides a quick way for measuring and validating of performance metrics, while other more specialized tools such as Instruments, DTrace, Heaptrack, Leaks, Sample and more can be used for attributing performance problems or for finding root causes for any deviations found.
Benchmark is suitable for both smaller ad-hoc benchmarks focusing on execution time and more extensive benchmarks that care about several additional metrics such as memory allocations, syscalls, thread usage, context switches, ARC traffic, and more. Using Histogram it’s especially suitable for capturing latency statistics for large number of samples.
Documentation on how to use Benchmark in your Swift package can be viewed online or inside Xcode using Build Documentation.
Additionally the command plugin provides help information if you run swift package benchmark help from the command line.
There are just a few steps required to get started benchmarking:
- Add a dependency to the Benchmark project
- Add benchmark executable targets with
swift package benchmark init - Add the snippet or code you want to benchmark
- Run
swift package benchmark
The steps in some detail:
To add the dependency on Benchmark, add the dependency to your package:
.package(url: "https://github.com/ordo-one/package-benchmark", .upToNextMajor(from: "1.4.0")),The absolutely easiest way to add new benchmark executable targets to your project is by using:
swift package --allow-writing-to-package-directory benchmark init MyNewBenchmarkTargetThis will perform the following steps for you:
- Create a Benchmarks/MyNewBenchmarkTarget directory
- Create a Benchmarks/MyNewBenchmarkTarget/MyNewBenchmarkTarget.swift benchmark target with the required boilerplate
- Add a new executable target for the benchmark to the end of your Package.swift file
The init command validates that the name you specify isn’t used by any existing target and will not overwrite any existing file with that name in the Benchmarks/ location.
After you’ve created the new target, you can directly run it with e.g.:
swift package benchmark --target MyNewBenchmarkTargetAlternatively if you don't want the plugin to modify your project directory, you can do the same steps manually:
Create an executable target in Package.swift for each benchmark suite you want to measure.
The source for all benchmarks must reside in a directory named Benchmarks in the root of your swift package.
The benchmark plugin uses this directory combined with the executable target information to automatically discover and run your benchmarks.
For each executable target, include dependencies on both Benchmark (supporting framework) and BenchmarkPlugin (boilerplate generator) from package-benchmark.
The following example shows an benchmark suite named My-Benchmark with the required dependency on Benchmark and the source files for the benchmark that reside in the directory Benchmarks/My-Benchmark:
.executableTarget(
      name: "My-Benchmark",
      dependencies: [
          .product(name: "Benchmark", package: "package-benchmark"),
      ],
      path: "Benchmarks/My-Benchmark",
      plugins: [
          .plugin(name: "BenchmarkPlugin", package: "package-benchmark"),
      ]
),There are documentation available as well as a a sample project using various aspects of this package in practice.
import Benchmark

let benchmarks = {
    Benchmark("Minimal benchmark") { benchmark in
      // measure something here
    }

    Benchmark("All metrics, full concurrency, async",
              configuration: .init(metrics: BenchmarkMetric.all,
                                   maxDuration: .seconds(10)) { benchmark in
        let _ = await withTaskGroup(of: Void.self, returning: Void.self, body: { taskGroup in
            for _ in 0..<80  {
                taskGroup.addTask {
                    dummyCounter(defaultCounter()*1000)
                }
            }
            for await _ in taskGroup {
            }
        })
    }
}To execute all defined benchmarks, simply run:
swift package benchmark
Please see the documentation for more detail on all options.


Install YouPlot
swift package benchmark run --filter InternalUTCClock-now --metric wallClock --format histogramPercentiles --path stdout --no-progress | uplot lineplot -H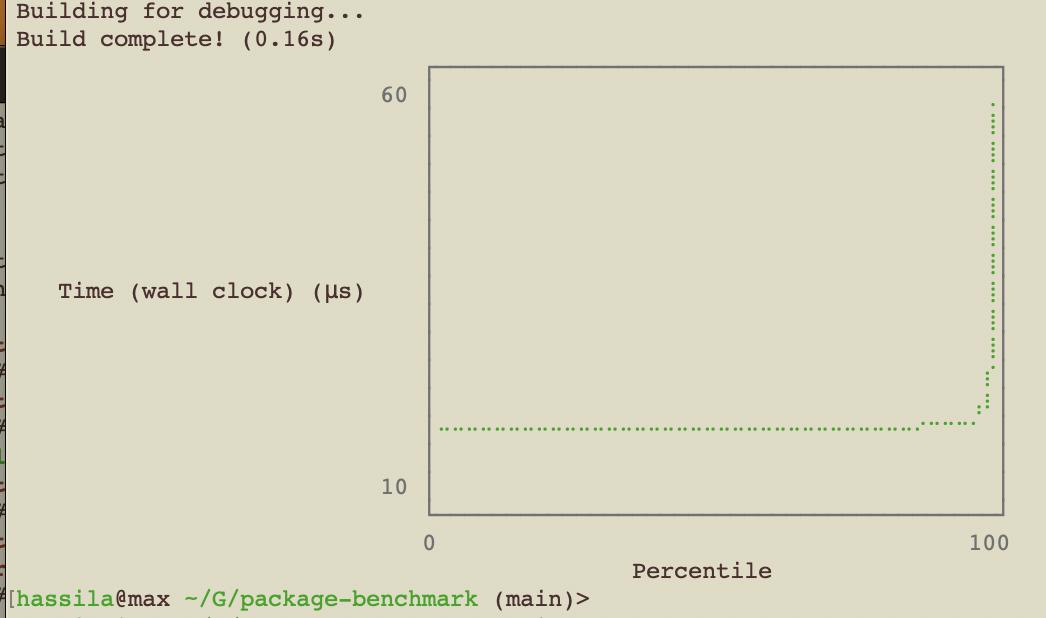
Using jmh.morethan.io


The default text output from Benchmark is oriented around the five-number summary percentiles, plus the last decile (p90) and the last percentile (p99) - it's thus a variation of a seven-figure summary with the focus on the 'bad' end of results (as those are what we typically care about addressing).
We've found that focusing on percentiles rather than average or standard deviations, is more useful for a wider range of benchmark measurements and gives a deeper understanding of the results.
Percentiles allows for a consistent way of expressing benchmark results of both throughput and latency measurements (which typically do not have a standardized distribution, being almost always multi-modal in nature).
This multi-modal nature of the latency measurements leads to the common statistical measures of mean and standard deviation being potentially misleading.
The API will be deemed stable as of 1.0.0 and follows semantical versioning for future releases.
The export file formats that are externally defined (e.g. JMH or HDR Histogram formats) will follow the upstream definitions if they change, but have been quite stable for several years.
The Histogram codable representation is not stable and may change if the Histogram implementation changes.
The benchmark internal baseline representation (stored in .benchmarkBaselines) is not stable and is not viewed as public API and may break over time.
For those wanting to save benchmark data over time, it's recommended to export data in e.g. HDR Histogram representations (percentiles, average, stddev etc) or simply post processing the histogramSamples format (which is raw data) to your desired representation.
PR:s for additional standardized formats are welcome, as the export formats are the intended stable interface for saving such data.