![]()


AAInfographics is the Swift language version of AAChartKit which is object-oriented, a set of easy-to-use, extremely elegant graphics drawing controls,based on the popular open source front-end chart library Highcharts. It makes it very fast to add interactive charts to your mobile projects. It supports single touch-drag for data inspection, multi-touch for zooming, and advanced responsiveness for your apps .
-
🎂 Environment friendly. Support
iOS、iPadOSandmacOS. Totally supportSwiftlanguage, and there are more types version such asObjective-Clanguage version AAChartKit 、Javalanguage version AAChartCore 、Kotlinlanguage version AAInfographics . To get more details you can see the source code links list. -
🚀 Powerful and easy to use. It supports
column chart,bar chart,area chart,areaspline chart,line chart,spline chart,radar chart,polar chart,pie chart,bubble chart,packedbubble chart,pyramid chart,funnel chart,columnpyramid chart,columnrange chart,arearange chart,mixed chartand other graphics. Support for more chart types is planned. -
📝 Modern Declarative Syntax. Unlike previous imperative programming techniques, drawing any custom chart in AAChartKit, you don't need to care about the inner implementation details which is annoying && boring. Describe what you want, you will get what you described.
-
🎮 Interactive and animated. The charts
animationeffect is exquisite, delicate, smooth and beautiful. -
⛓ Chain programming. Supports
chain programming syntaxlike SwiftUI and Jetpack Compose. -
🦋 Minimalist.
AAChartView + AAChartModel = Chart. The AAInfographics follows a minimalist formula: Chart view + Chart model = The chart you want, just like the powerful and beautiful charts framework AAChartKit. -
🖱 Interaction event callback. Support for monitoring user click events and single finger move over events, which can be used to achieve double charts linked-working and even multiple charts linkage, as well as other more complex custom user interaction effects.
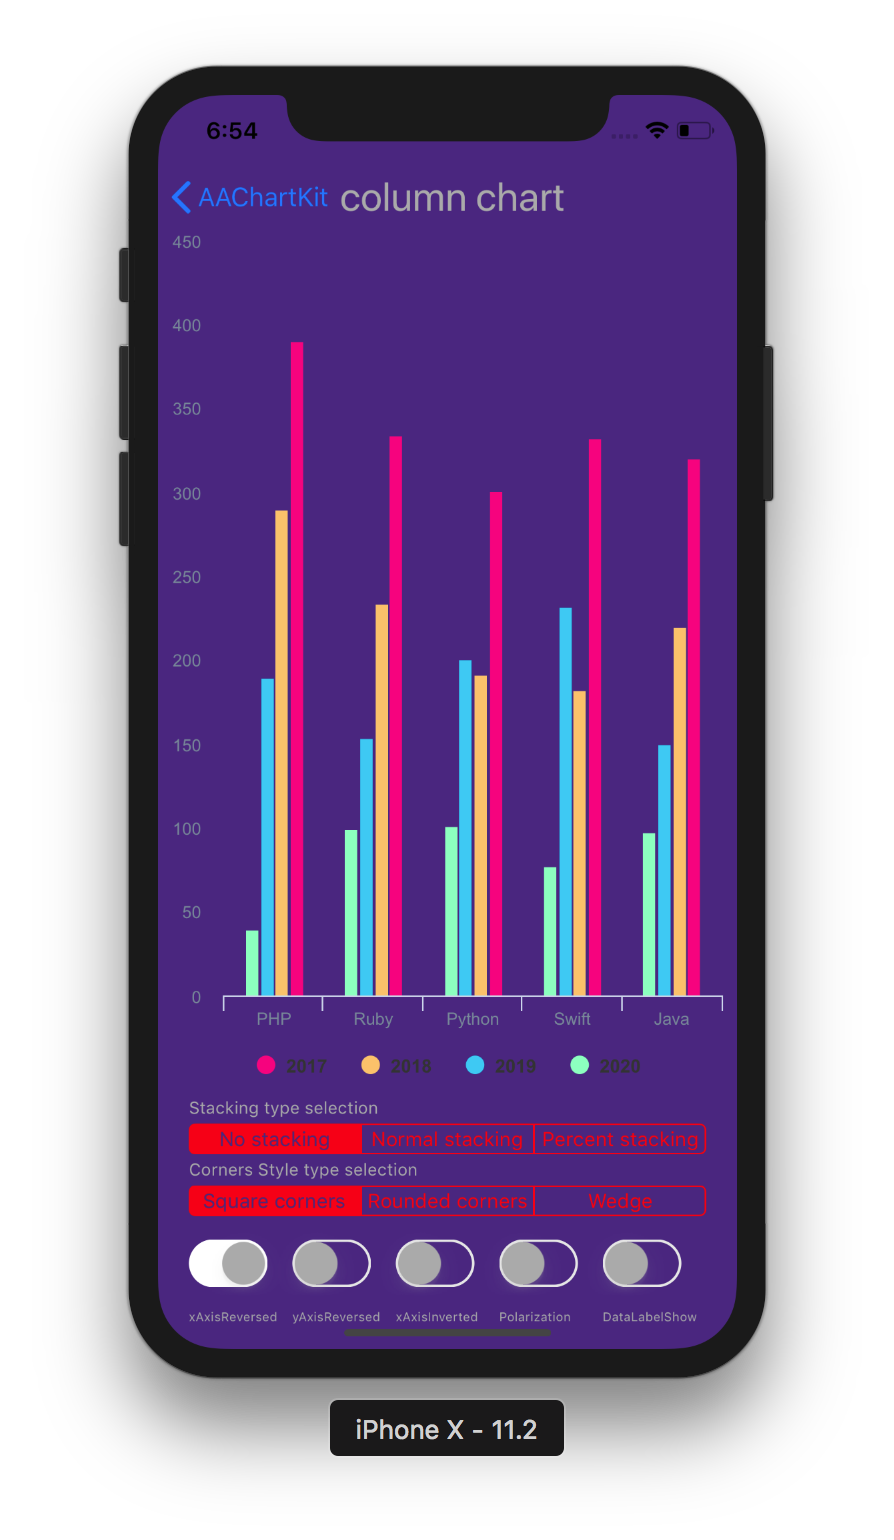
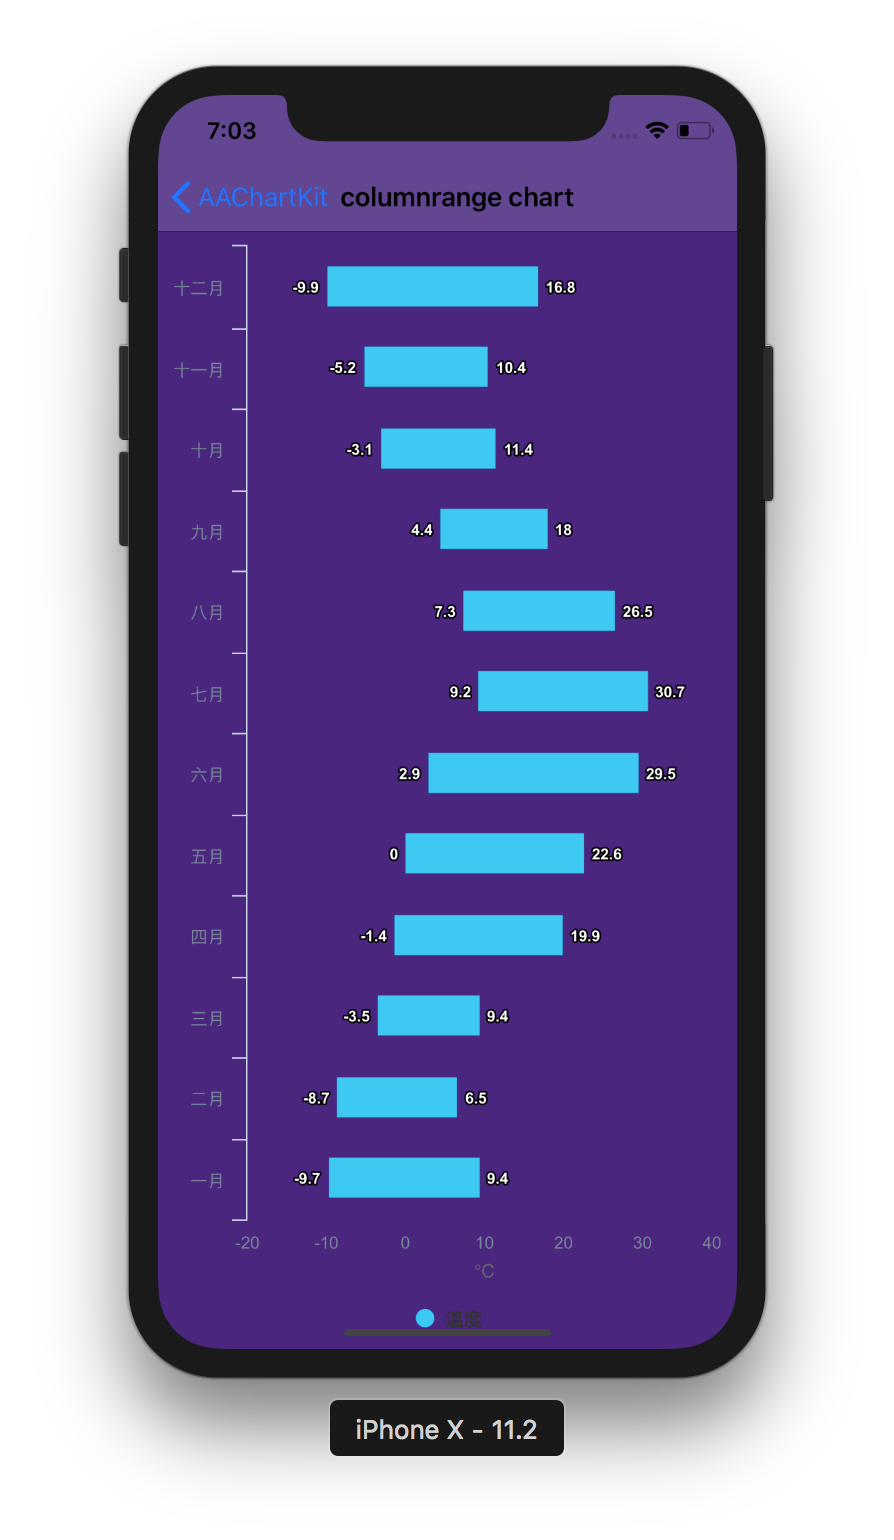
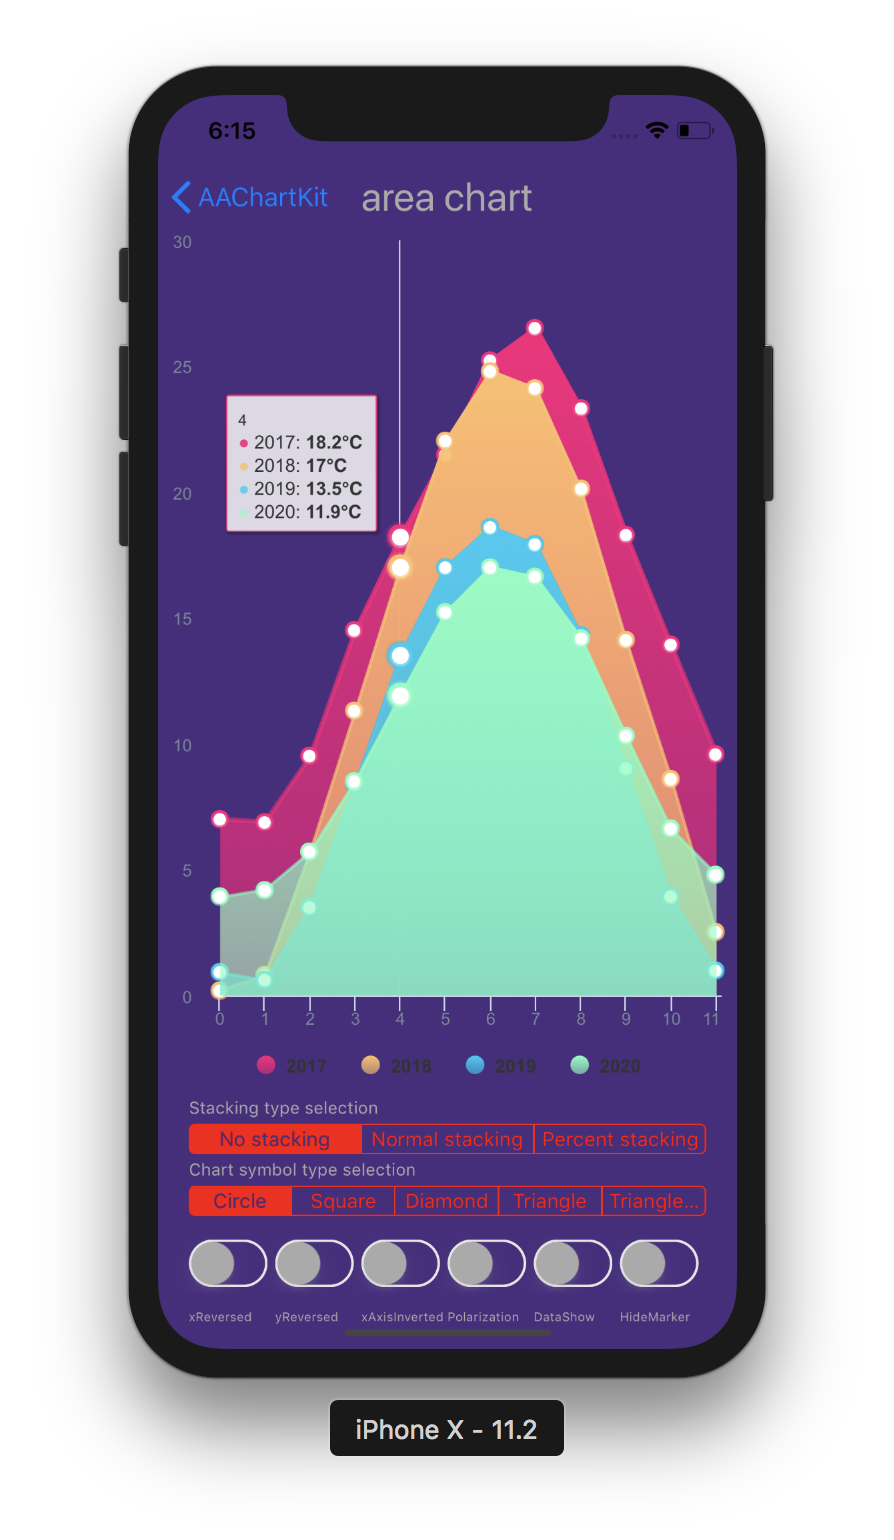
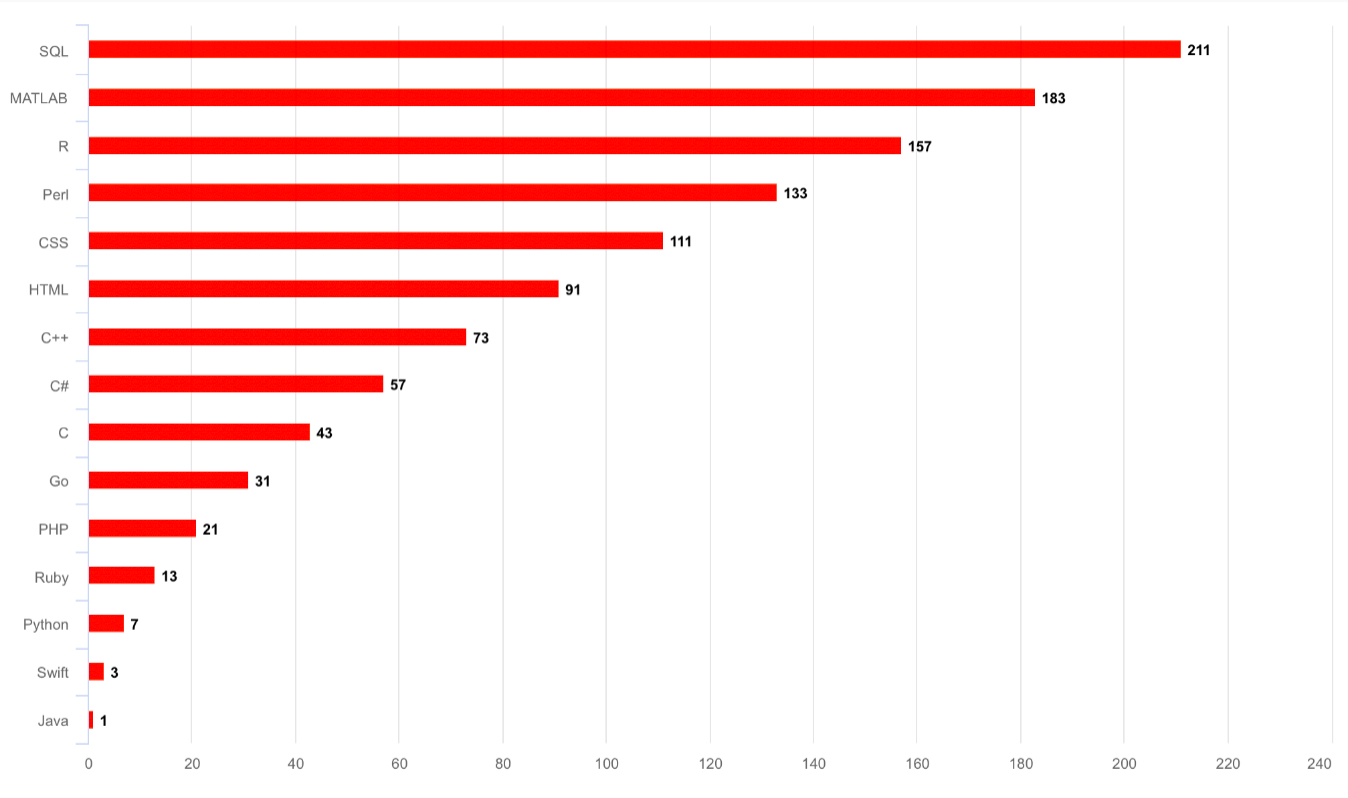
| Column Chart | Column Range Chart | Area Chart |
|---|---|---|
 |
 |
 |
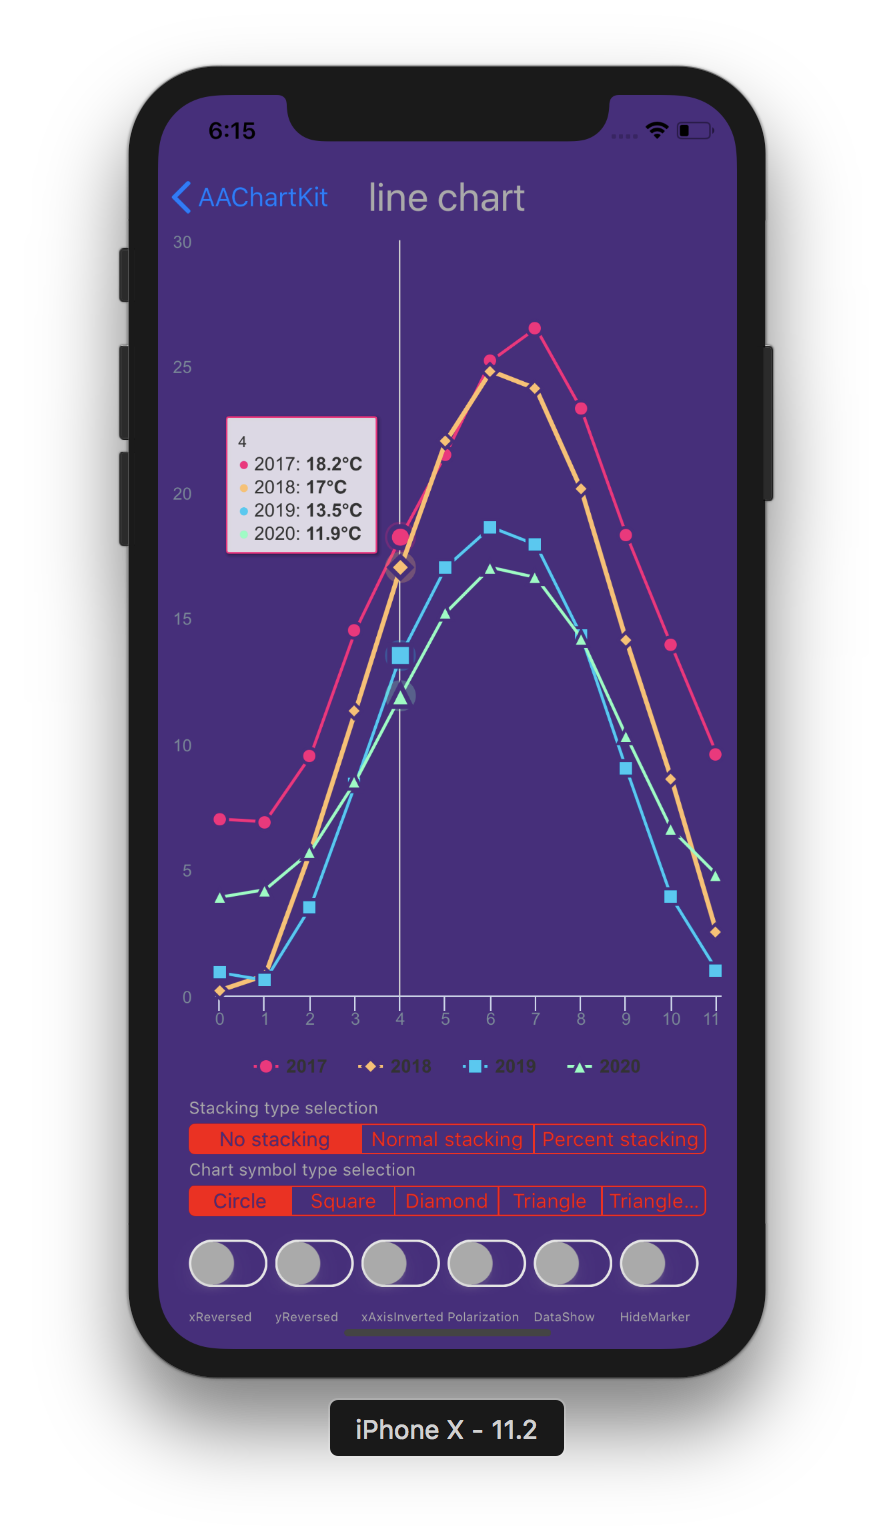
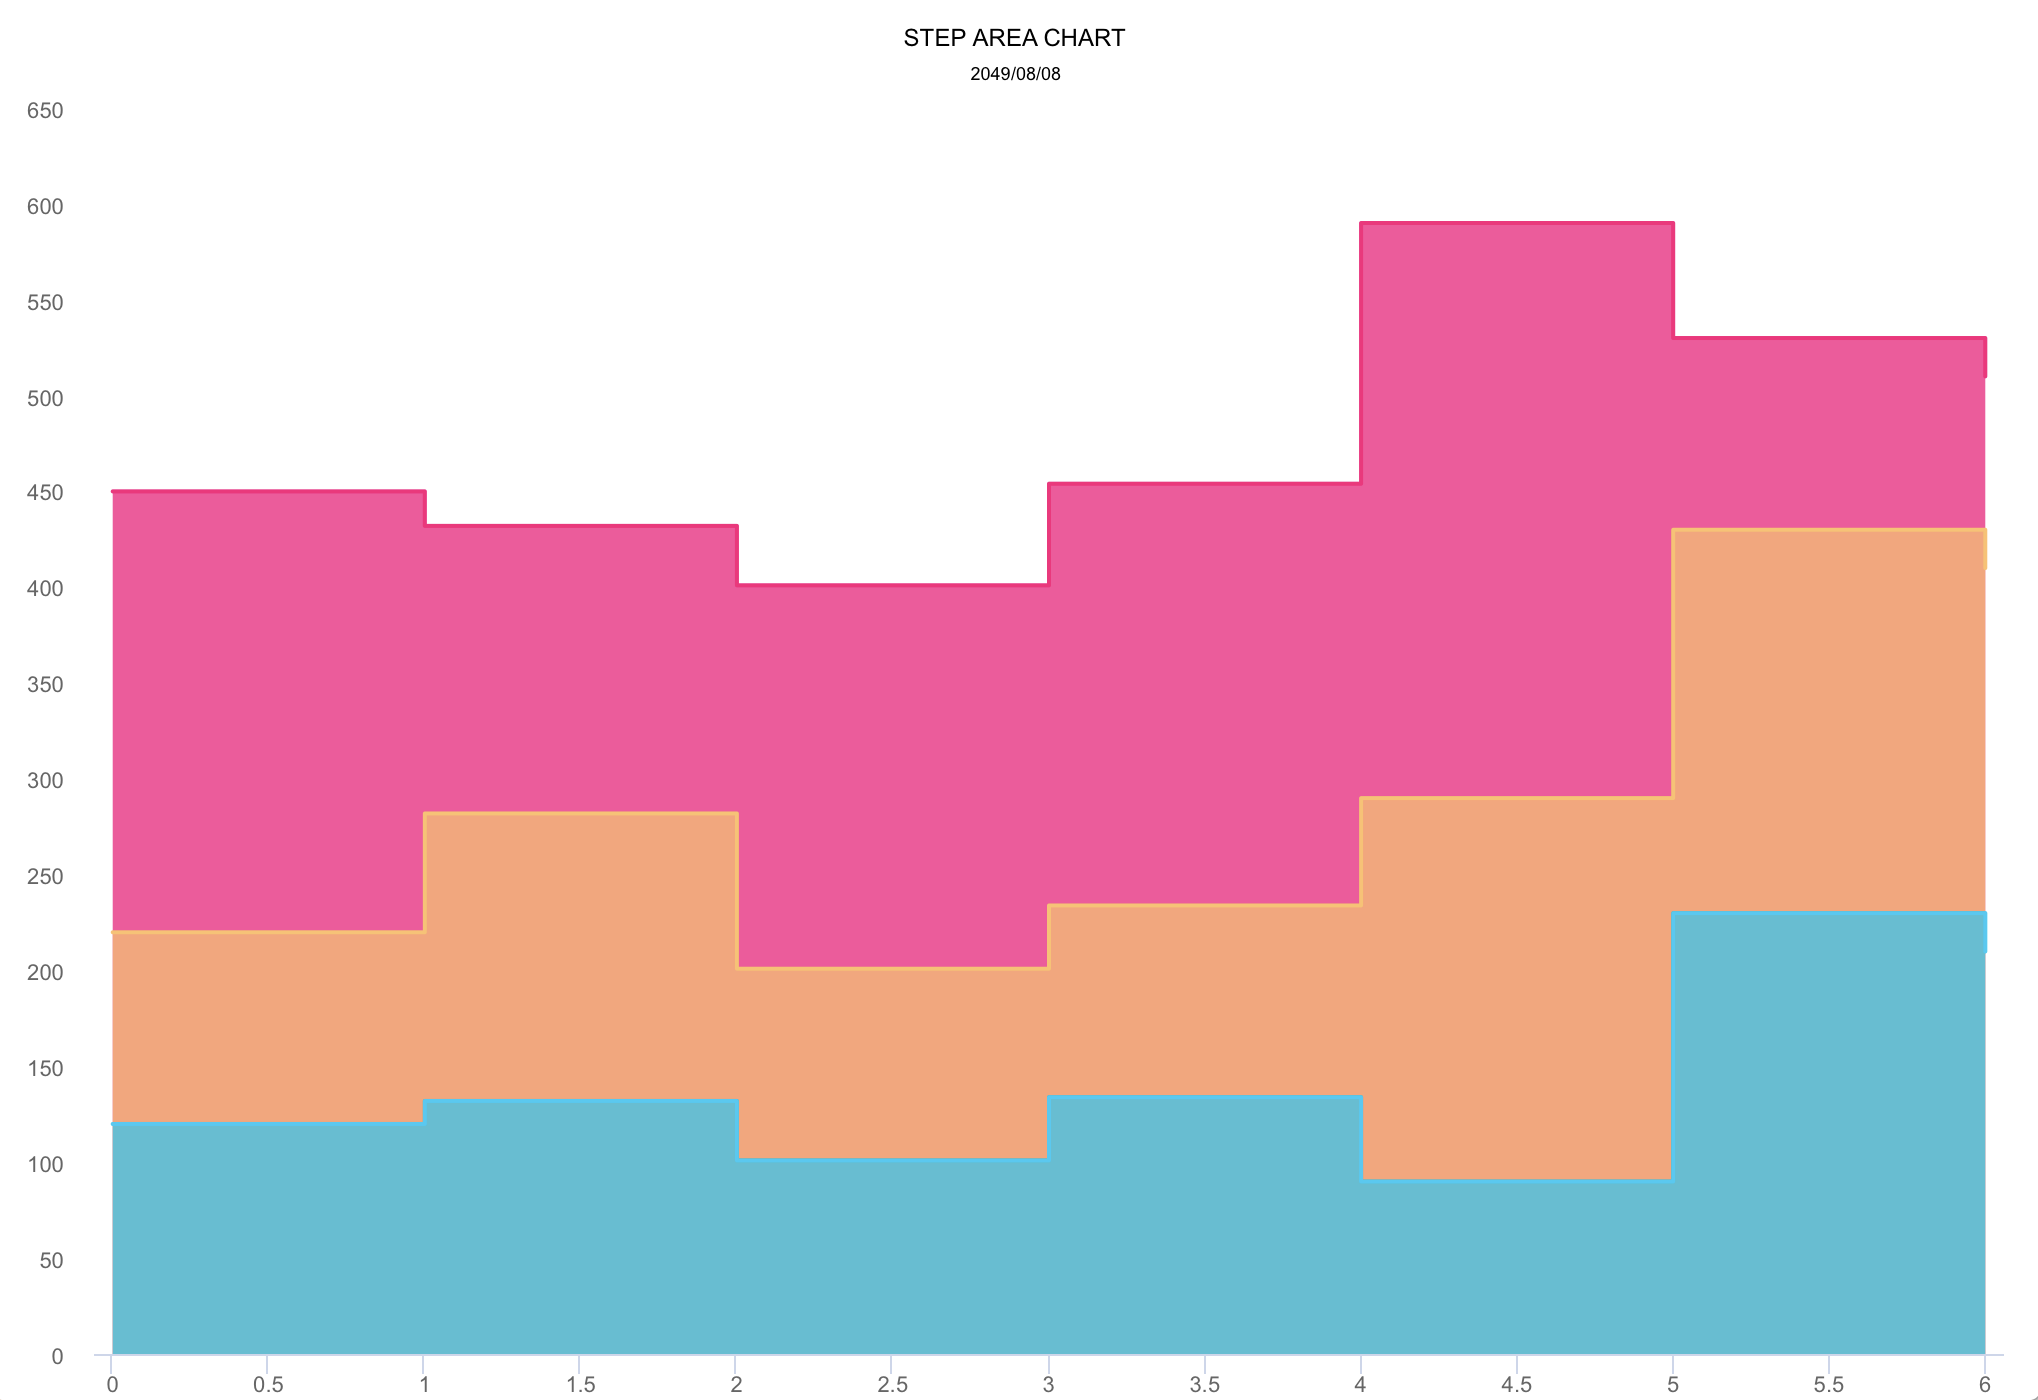
| Line Chart | Step Area Chart | Step Line Chart |
|---|---|---|
 |
 |
 |
| Spline Chart | Areaspline Chart | Stacked Polar Chart |
|---|---|---|
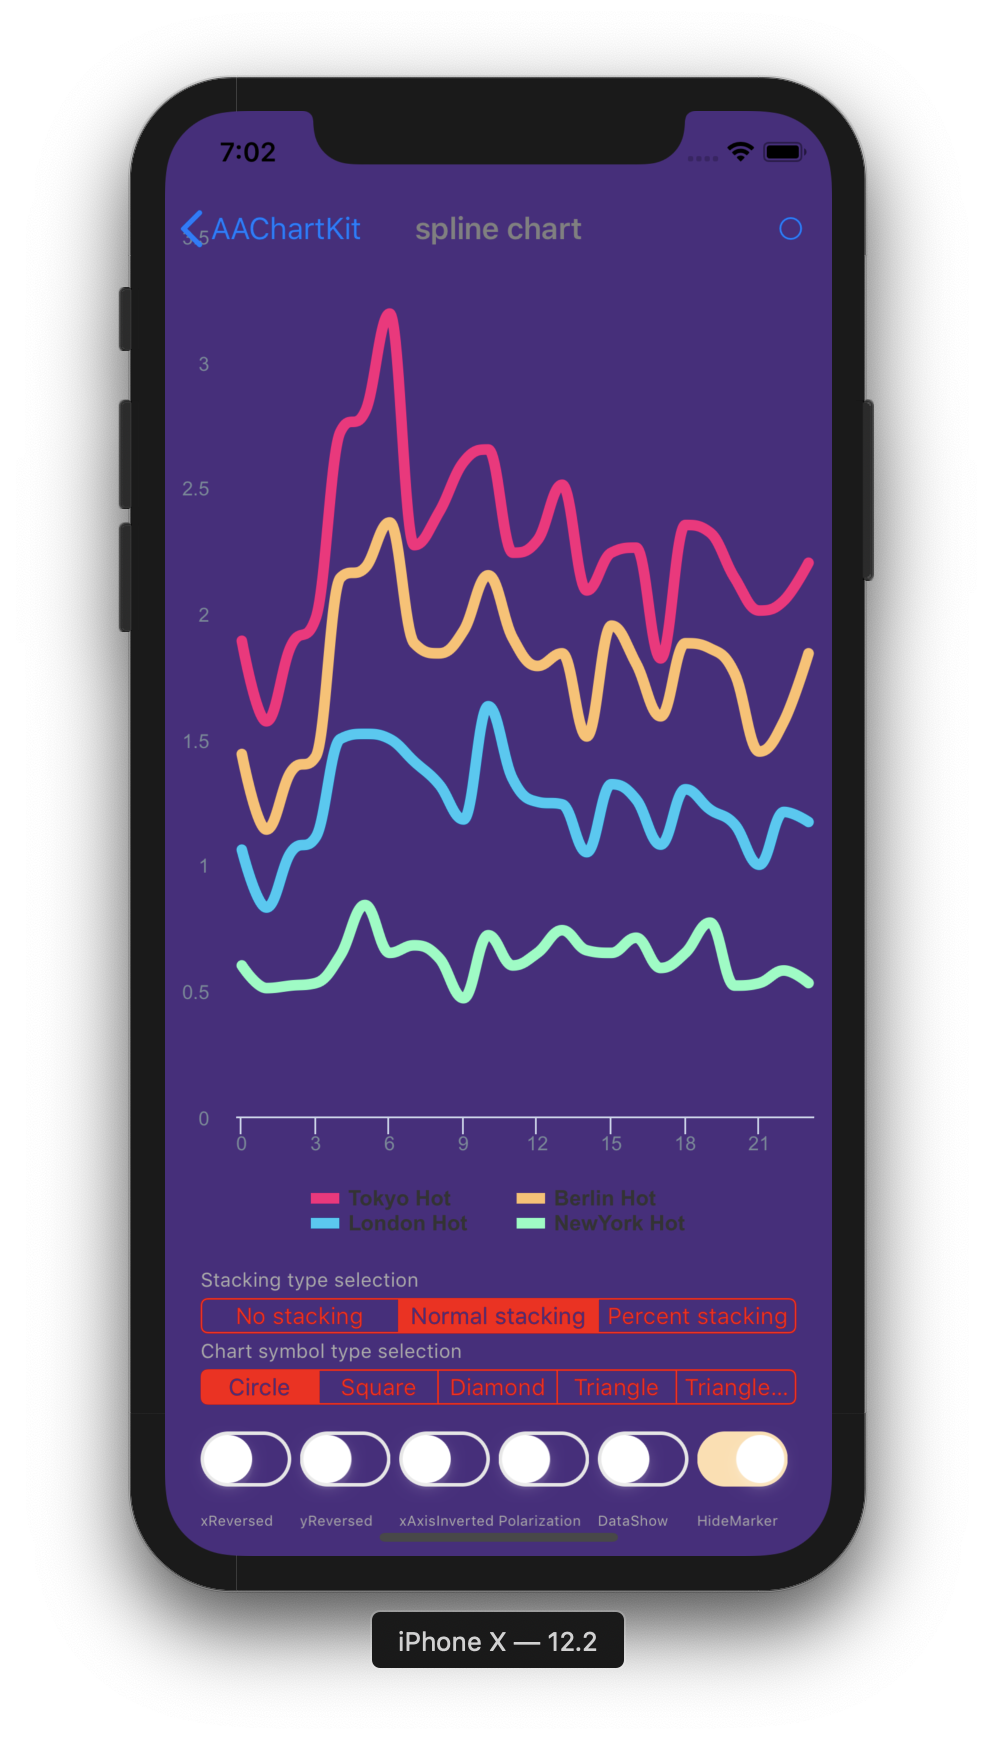 |
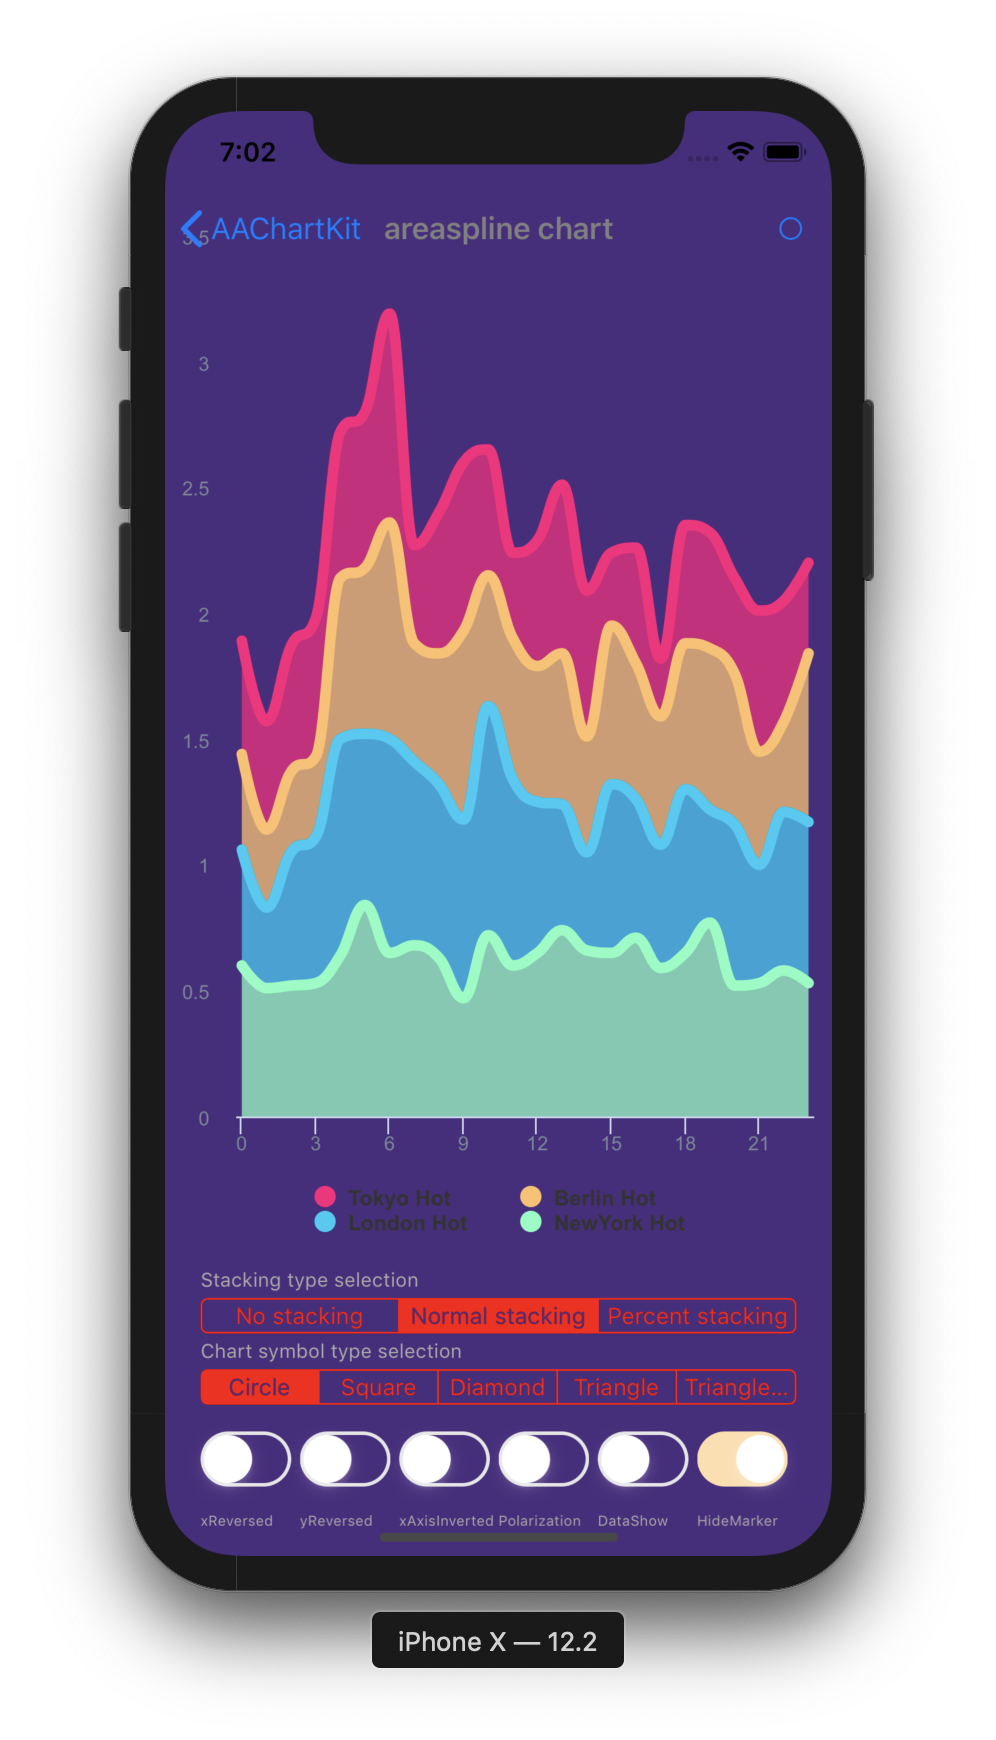 |
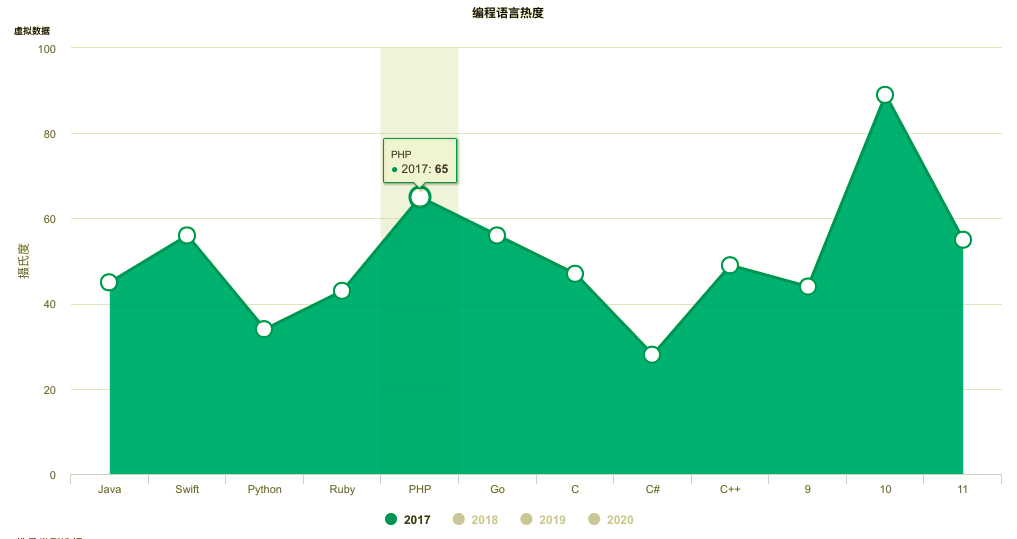
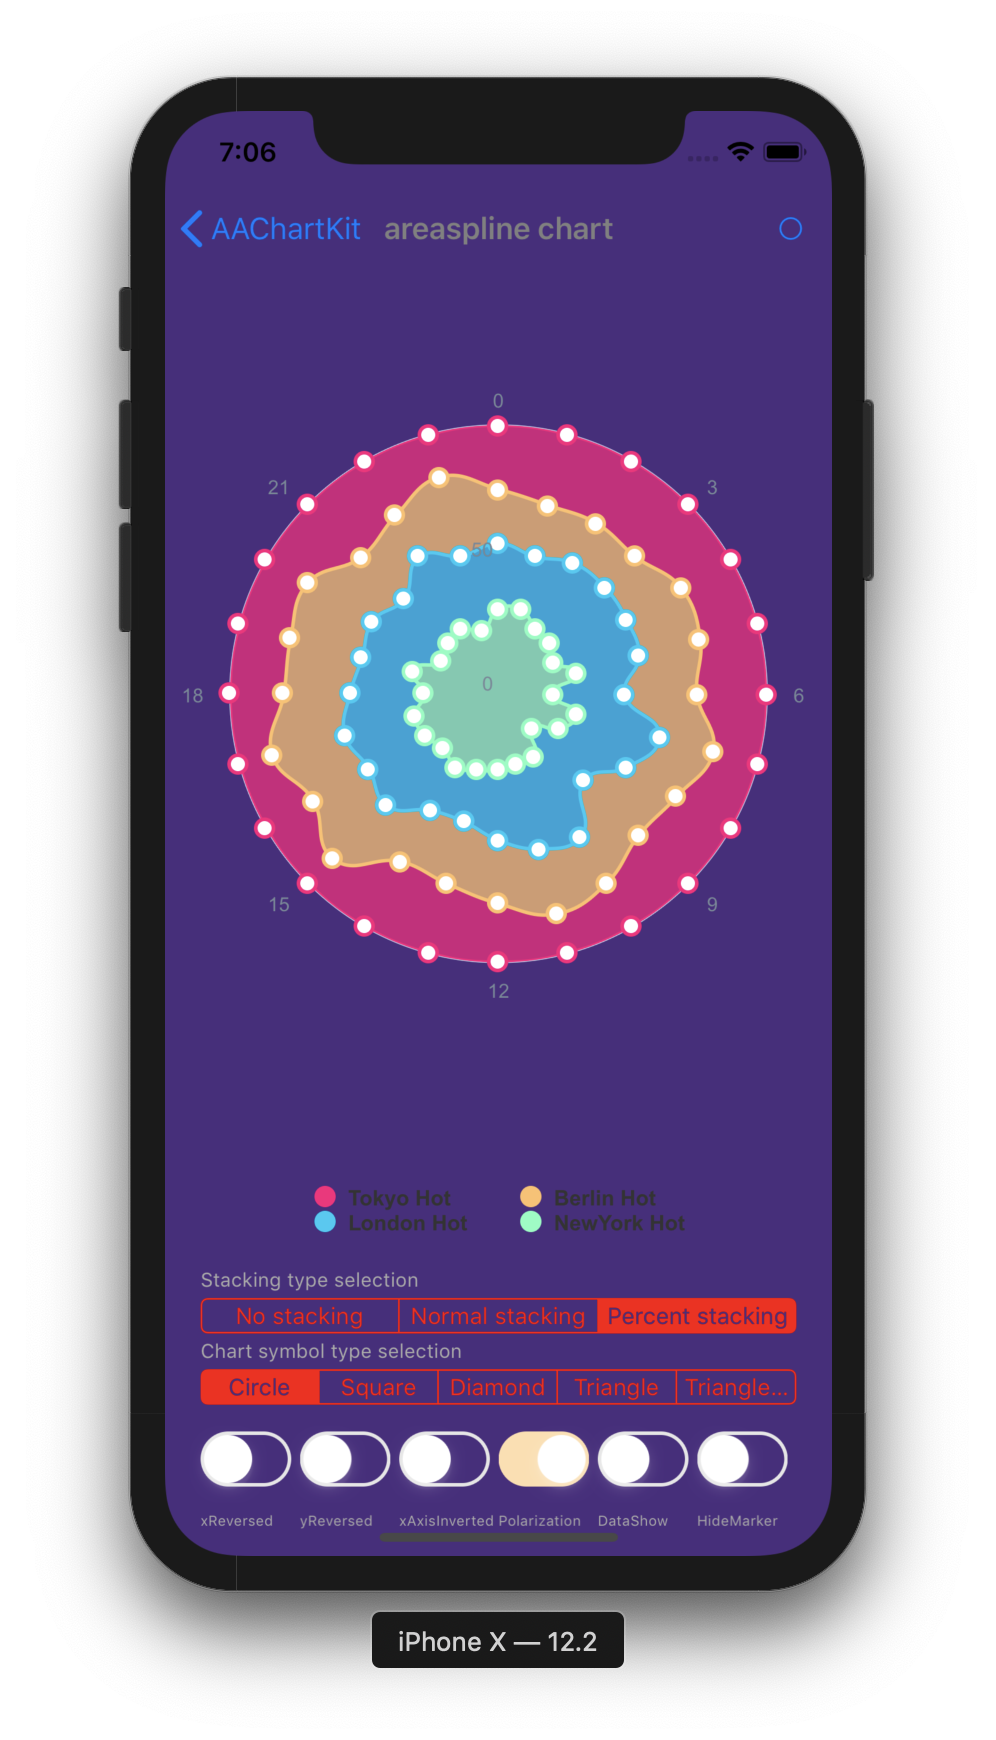 |
| Bubble Chart | Arearange Average Value Chart | Column Mixed Line Chart |
|---|---|---|
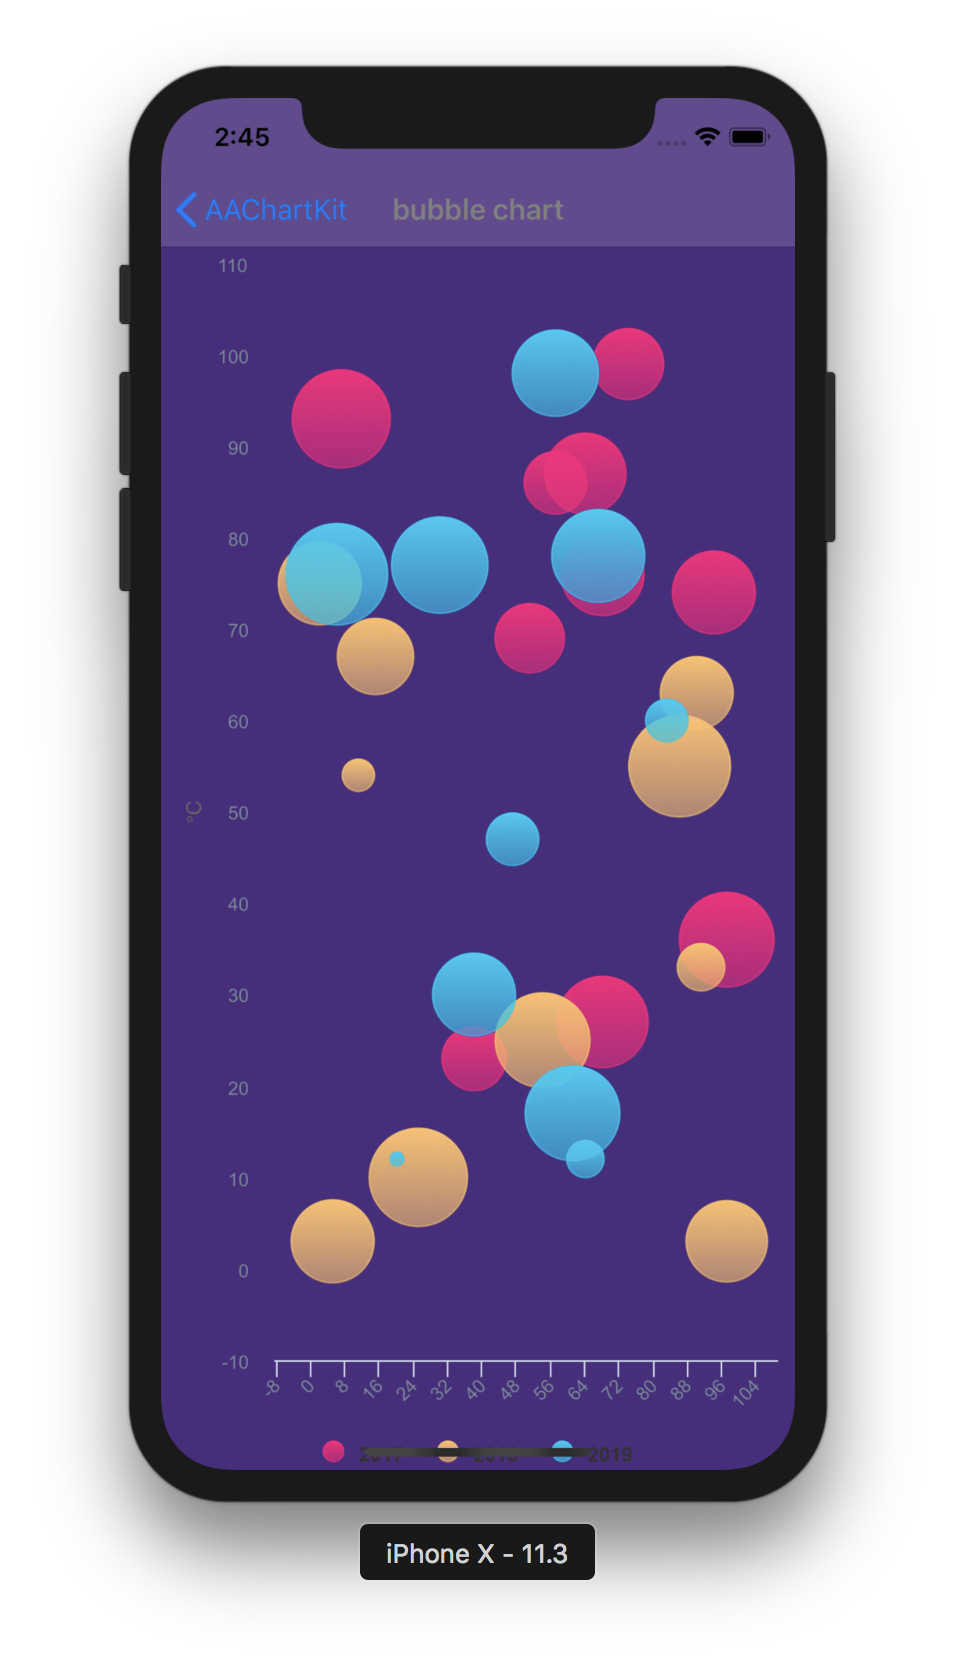 |
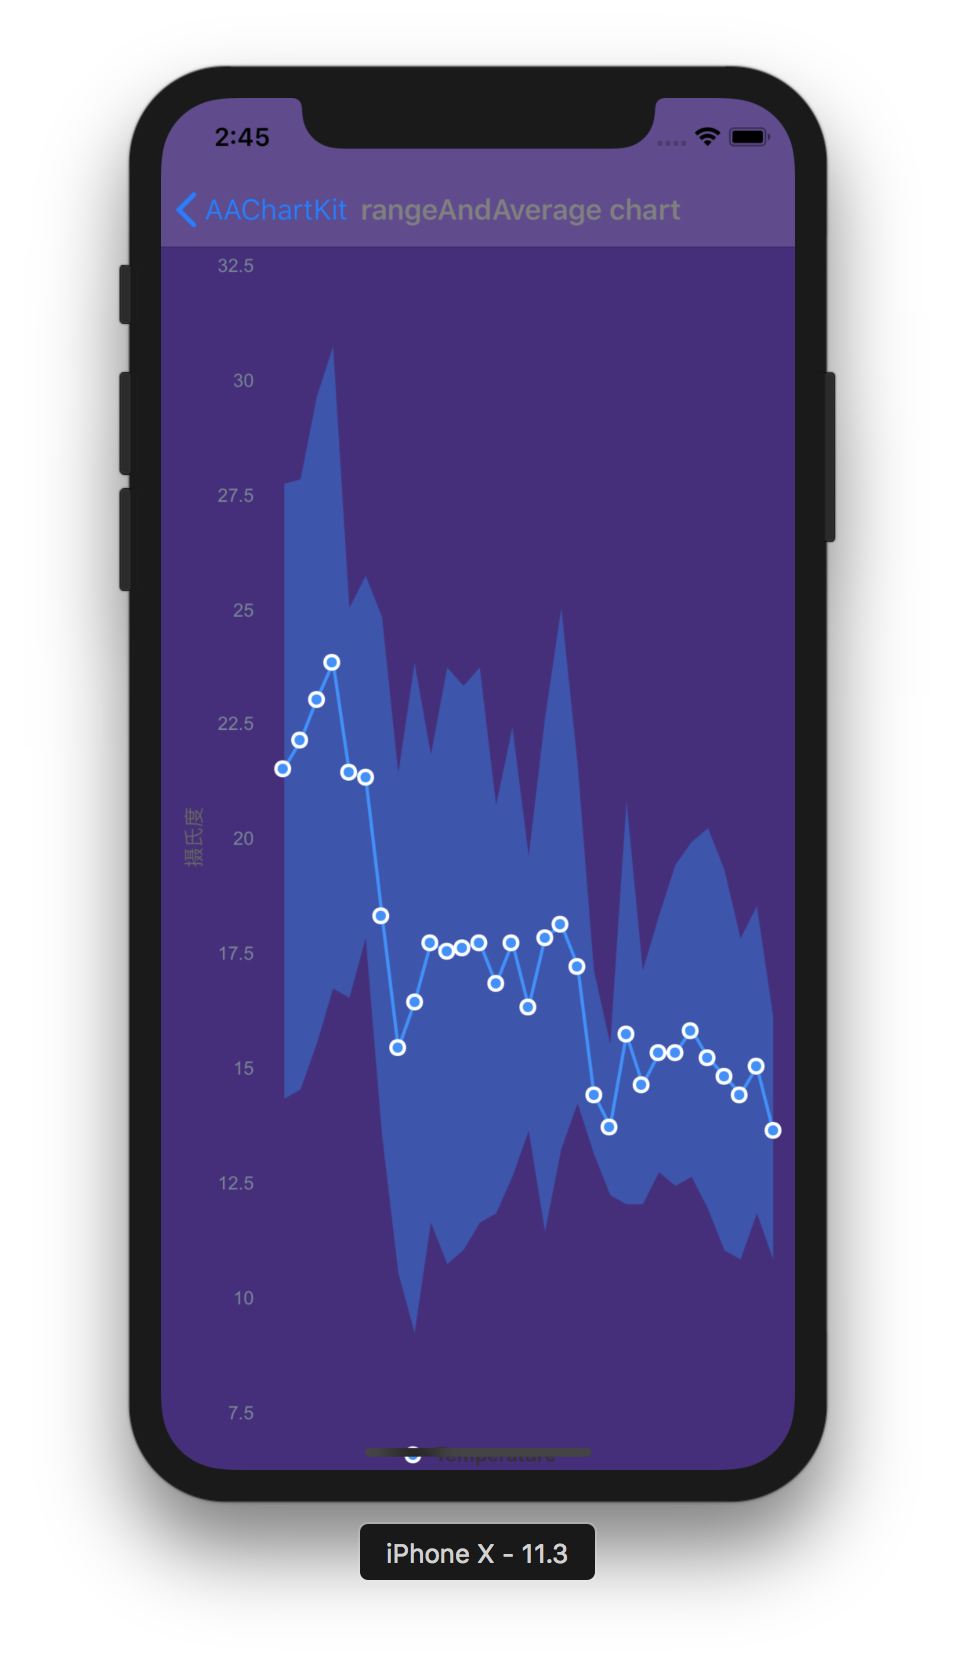 |
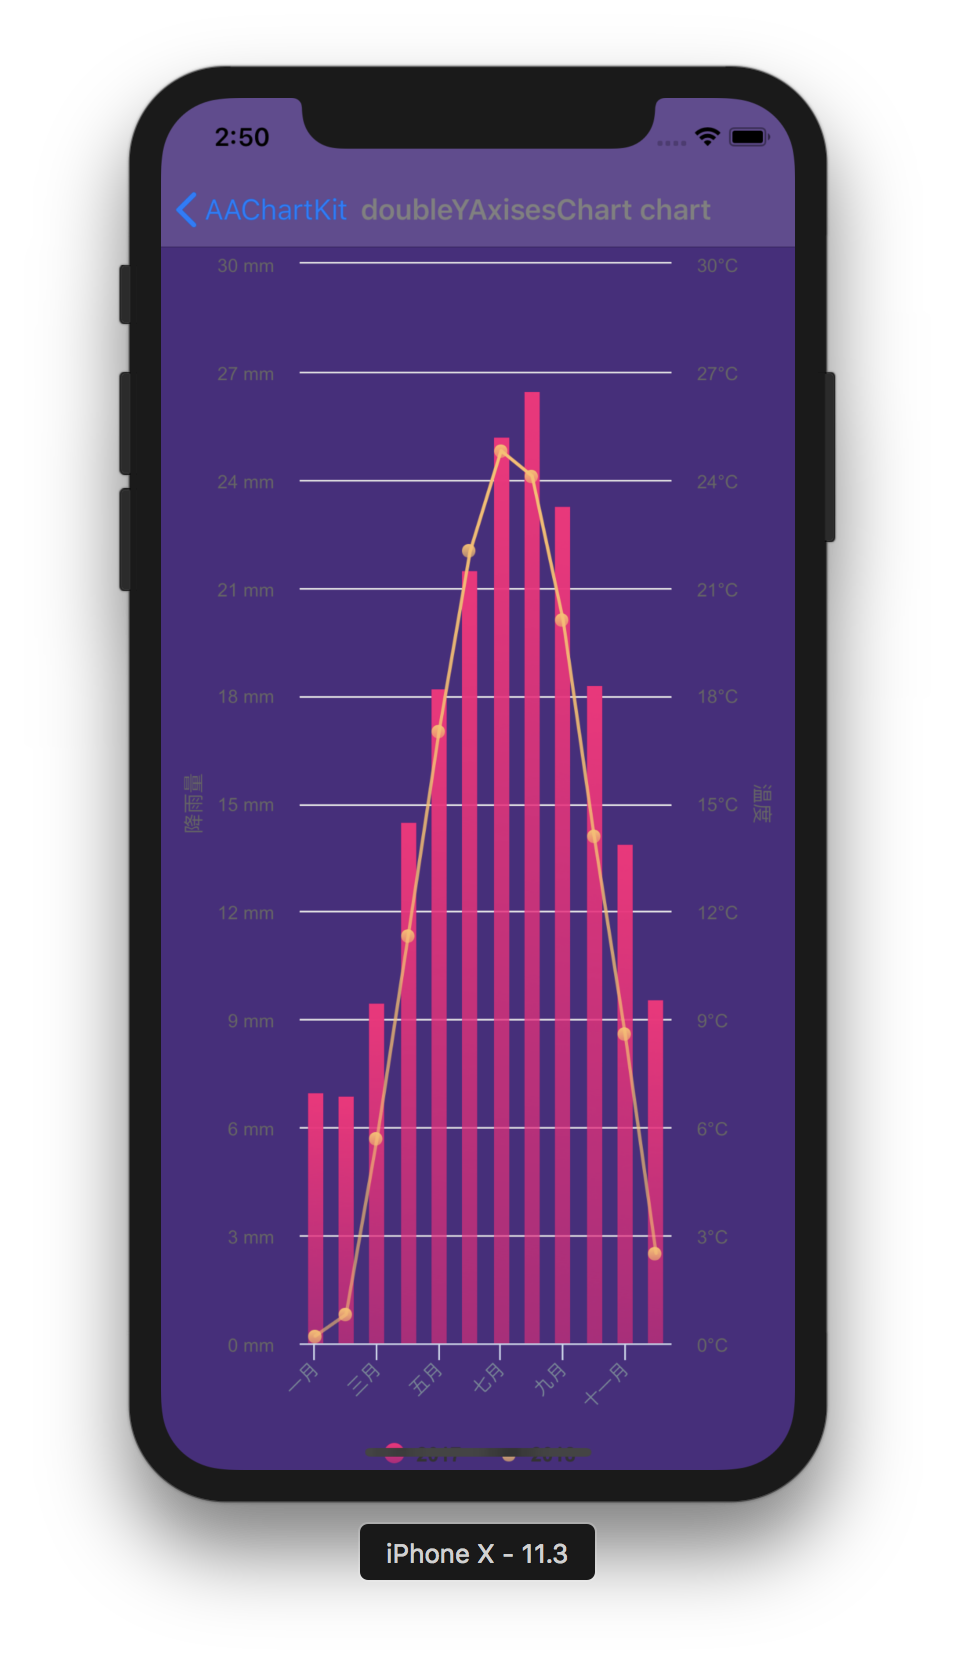 |
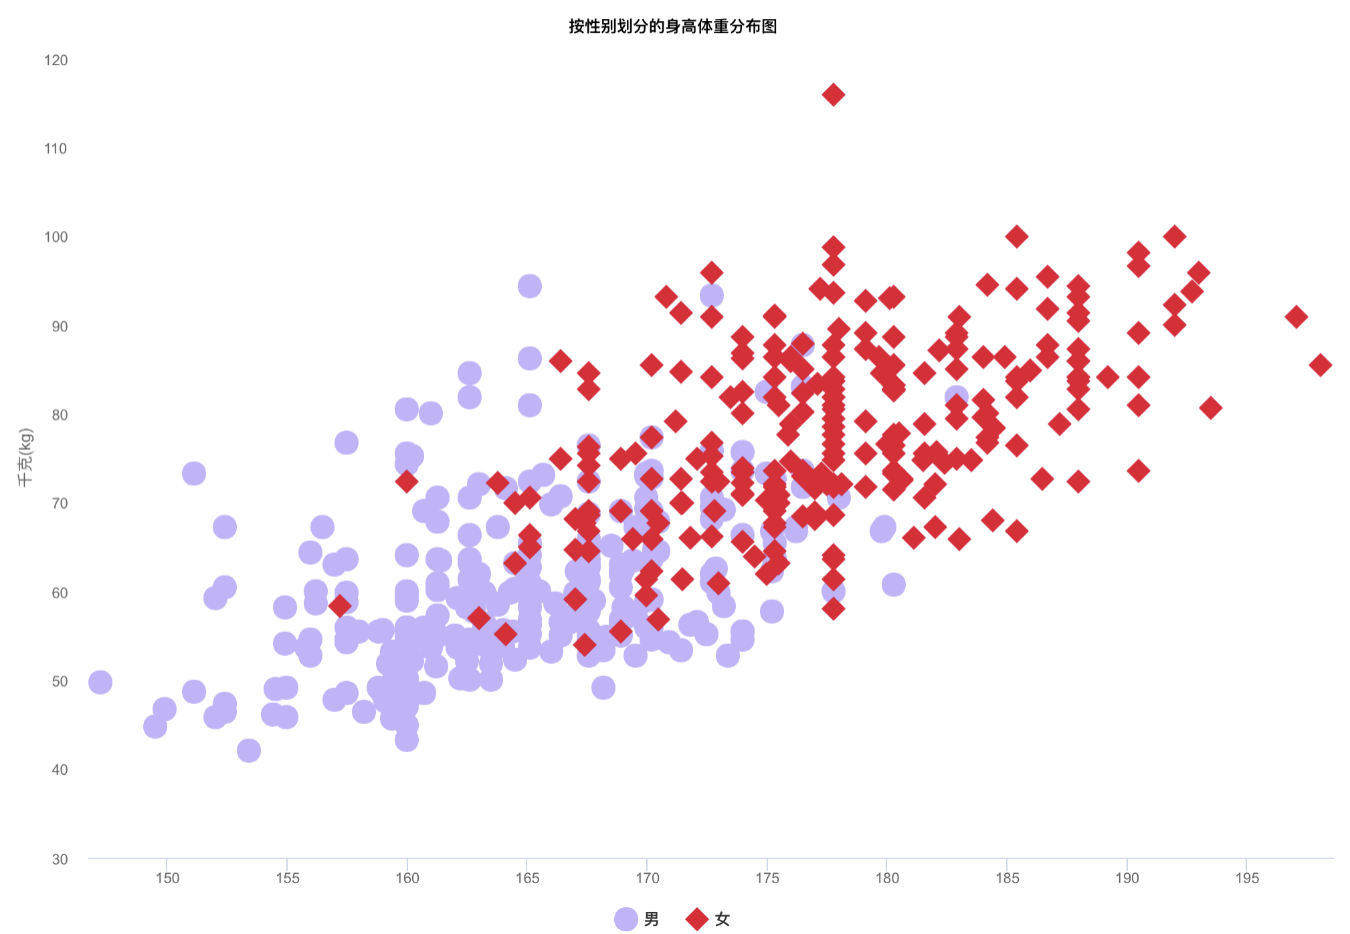
| Scatter Chart | Boxplot Chart | Mirror Column Chart |
|---|---|---|
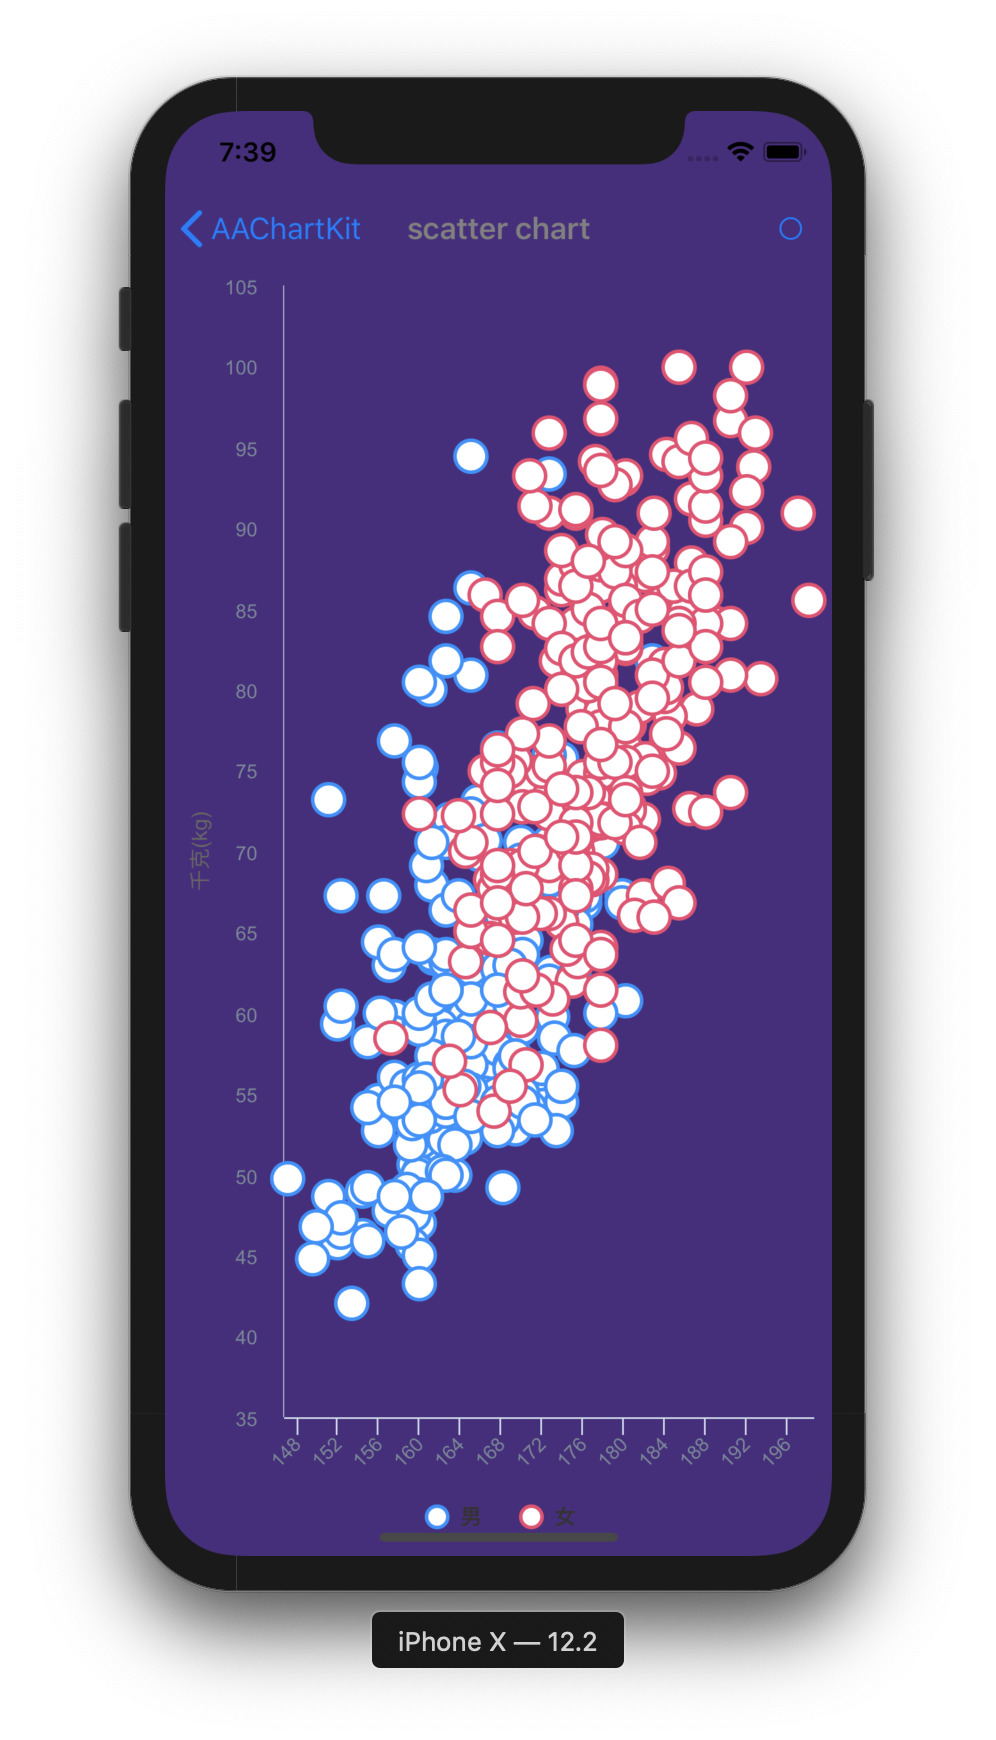 |
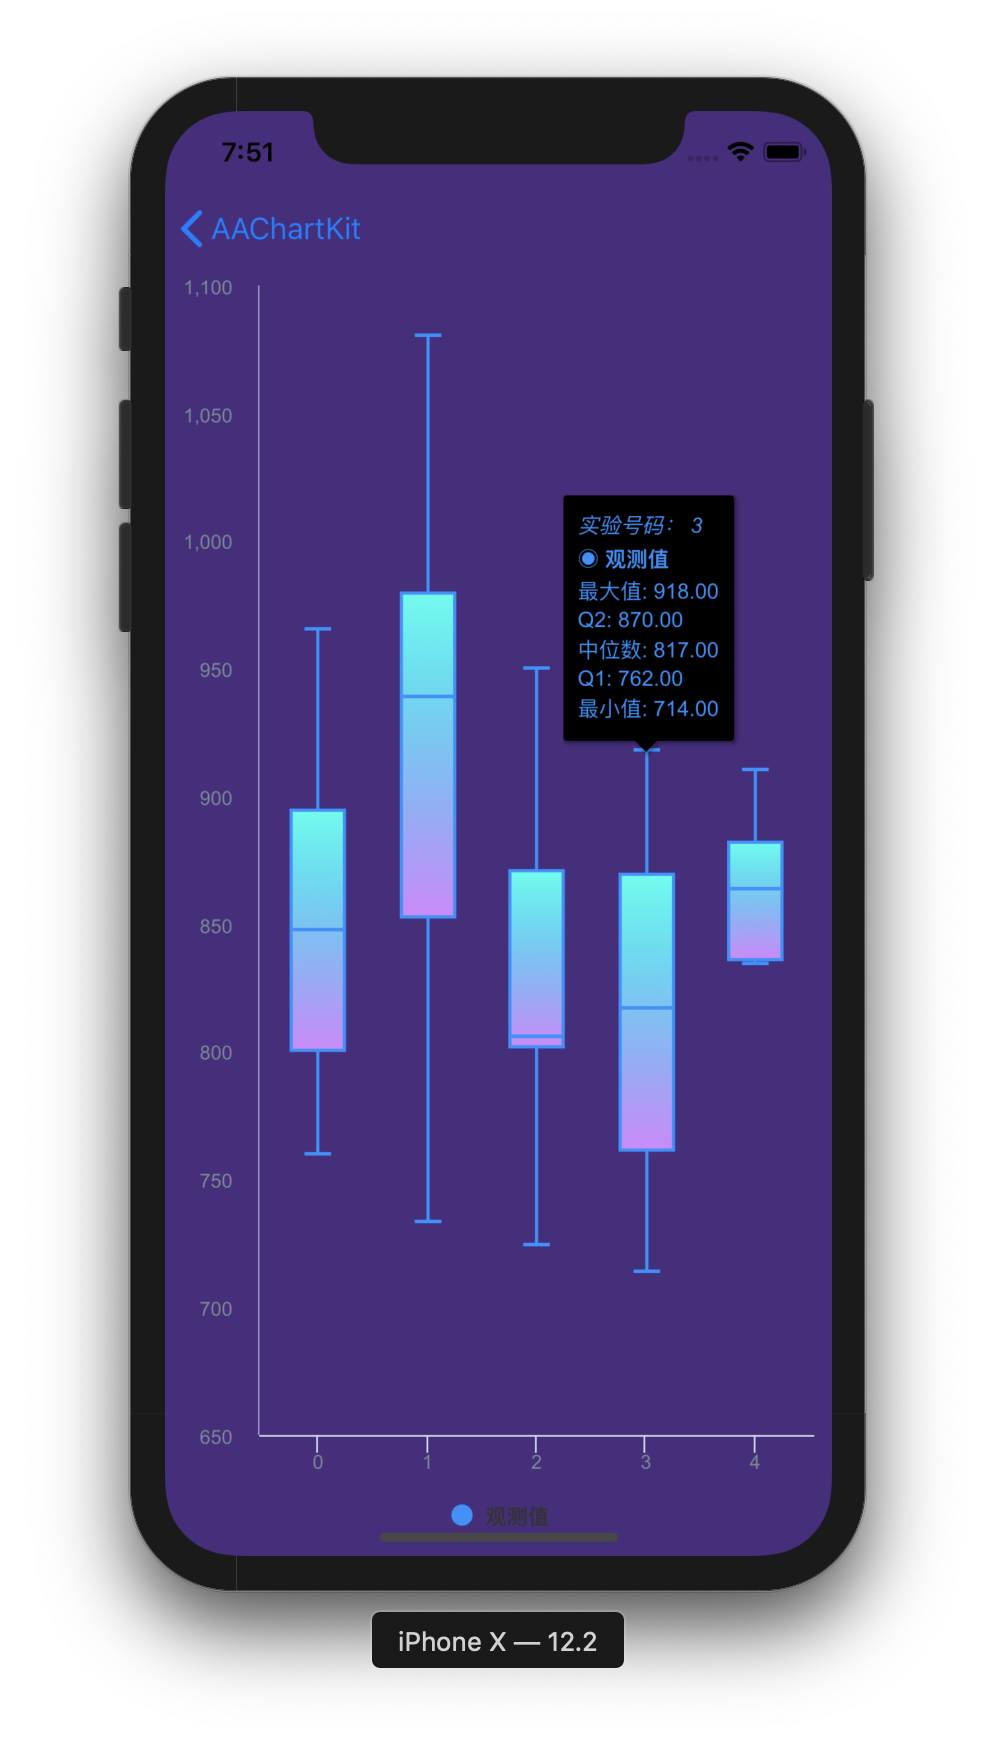 |
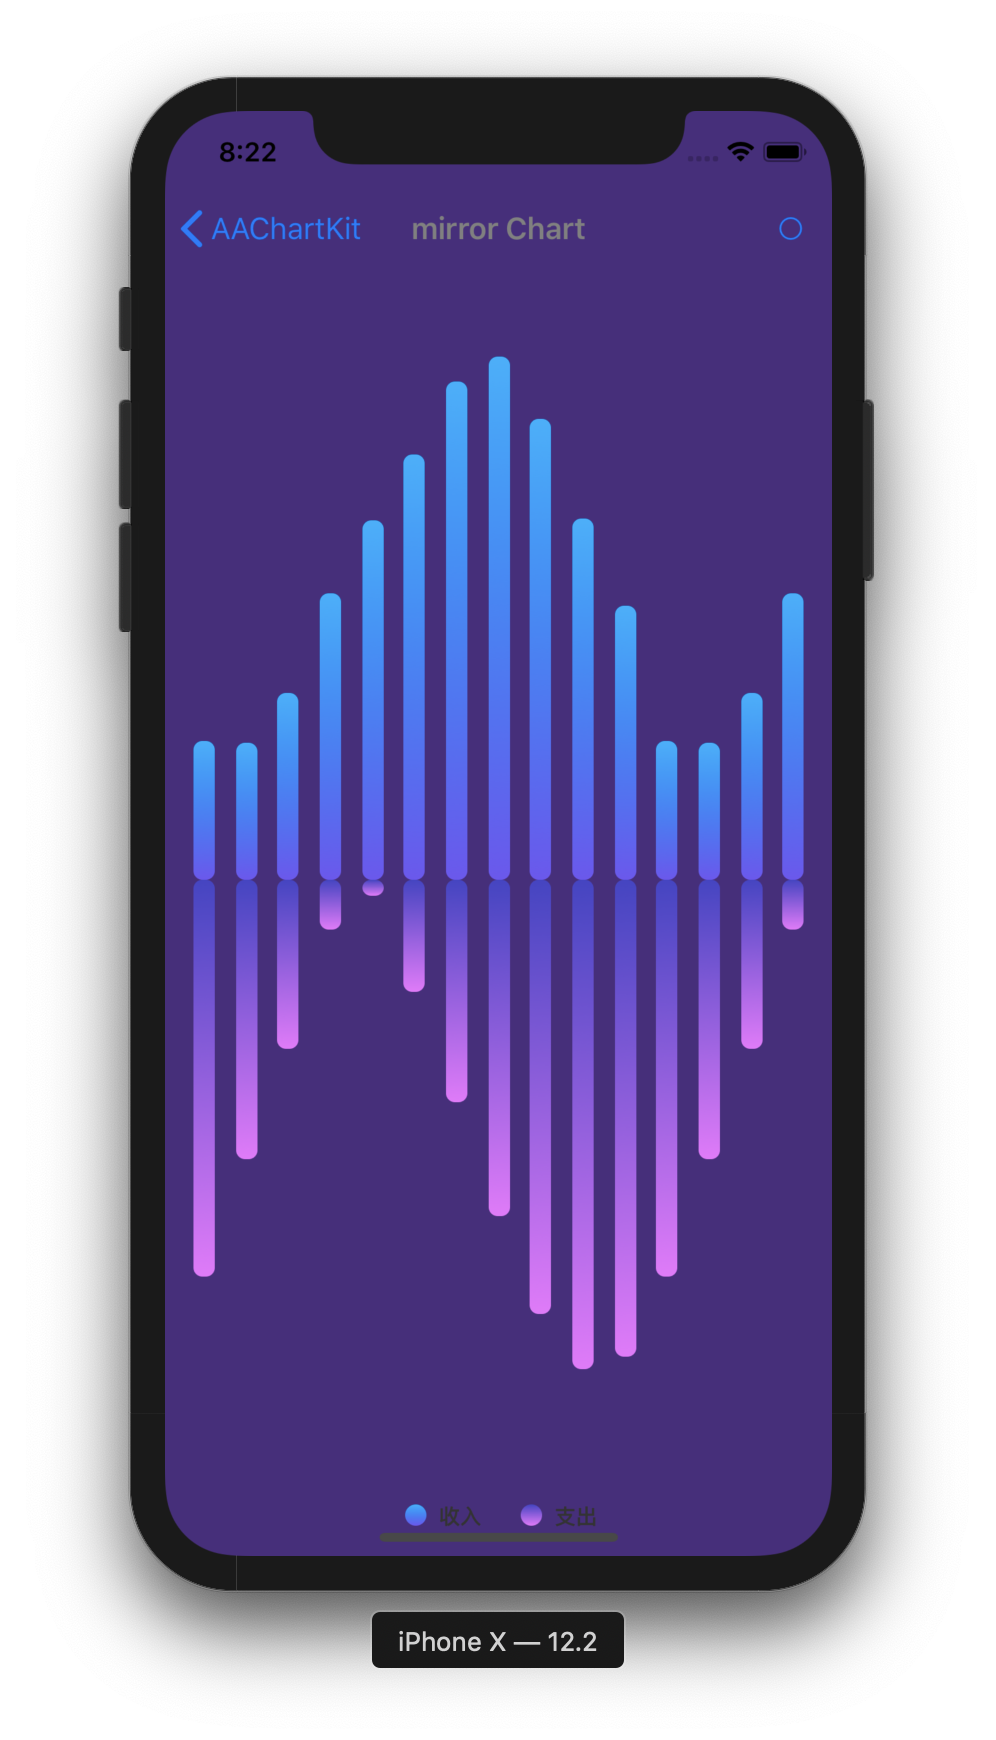 |
- Add following content
pod 'AAInfographics', :git => 'https://github.com/AAChartModel/AAChartKit-Swift.git'to your project Podfile.
- Run
pod installorpod update. - Import
AAInfographics.
- In Xcode, select
File > Add Package Dependencies... - Enter the package URL:
https://github.com/AAChartModel/AAChartKit-Swift.git
- Select version
9.5.0or later. - Add the
AAInfographicsproduct to your target.
If you use Package.swift, add the dependency like this:
dependencies: [
    .package(url: "https://github.com/AAChartModel/AAChartKit-Swift.git", from: "9.5.0")
],
targets: [
    .target(
        name: "YourTarget",
        dependencies: [
            .product(name: "AAInfographics", package: "AAChartKit-Swift")
        ]
    )
]- Add following content
github "https://github.com/AAChartModel/AAChartKit-Swift.git" ~> 9.5to your project Cartfile.
- Run
carthage bootstrap --use-xcframeworksorcarthage update --use-xcframeworks. - Link
AAInfographics.xcframeworkto your app target. - Import
AAInfographics.
- Download whole project demo of
AAInfographicsDemo - Drag the folder
AAInfographicsinto your project.
- Creat the instance object of chart view:
AAChartView
        let chartViewWidth  = self.view.frame.size.width
        let chartViewHeight = self.view.frame.size.height
        aaChartView = AAChartView()
        aaChartView?.frame = CGRect(x: 0,
                                    y: 60,
                                    width: chartViewWidth,
                                    height: chartViewHeight)
        // set the content height of aachartView
        // aaChartView?.contentHeight = self.view.frame.size.height
self.view.addSubview(aaChartView!)- Configure the properties of chart model:
AAChartModel
let aaChartModel = AAChartModel()
.chartType(.area)//Can be any of the chart types listed under `AAChartType`.
.animationType(.bounce)
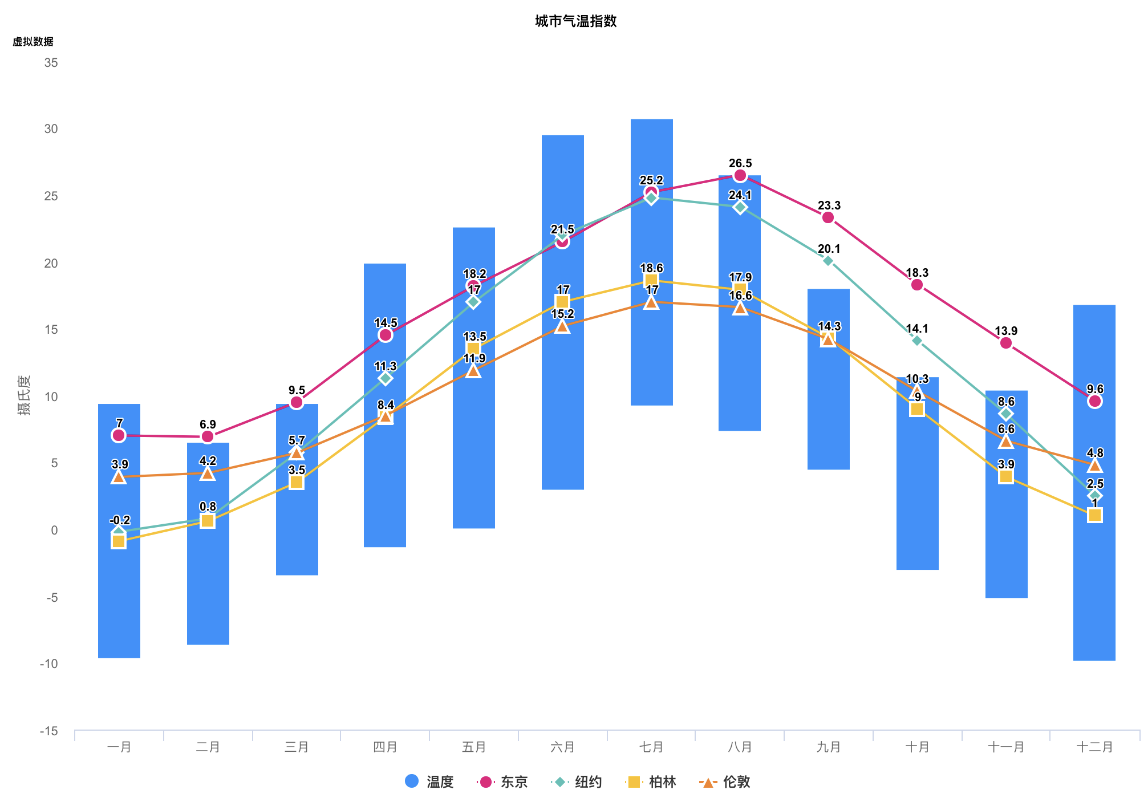
.title("TITLE")//The chart title
.subtitle("subtitle")//The chart subtitle
.dataLabelsEnabled(false) //Enable or disable the data labels. Defaults to false
.tooltipValueSuffix("USD")//the value suffix of the chart tooltip
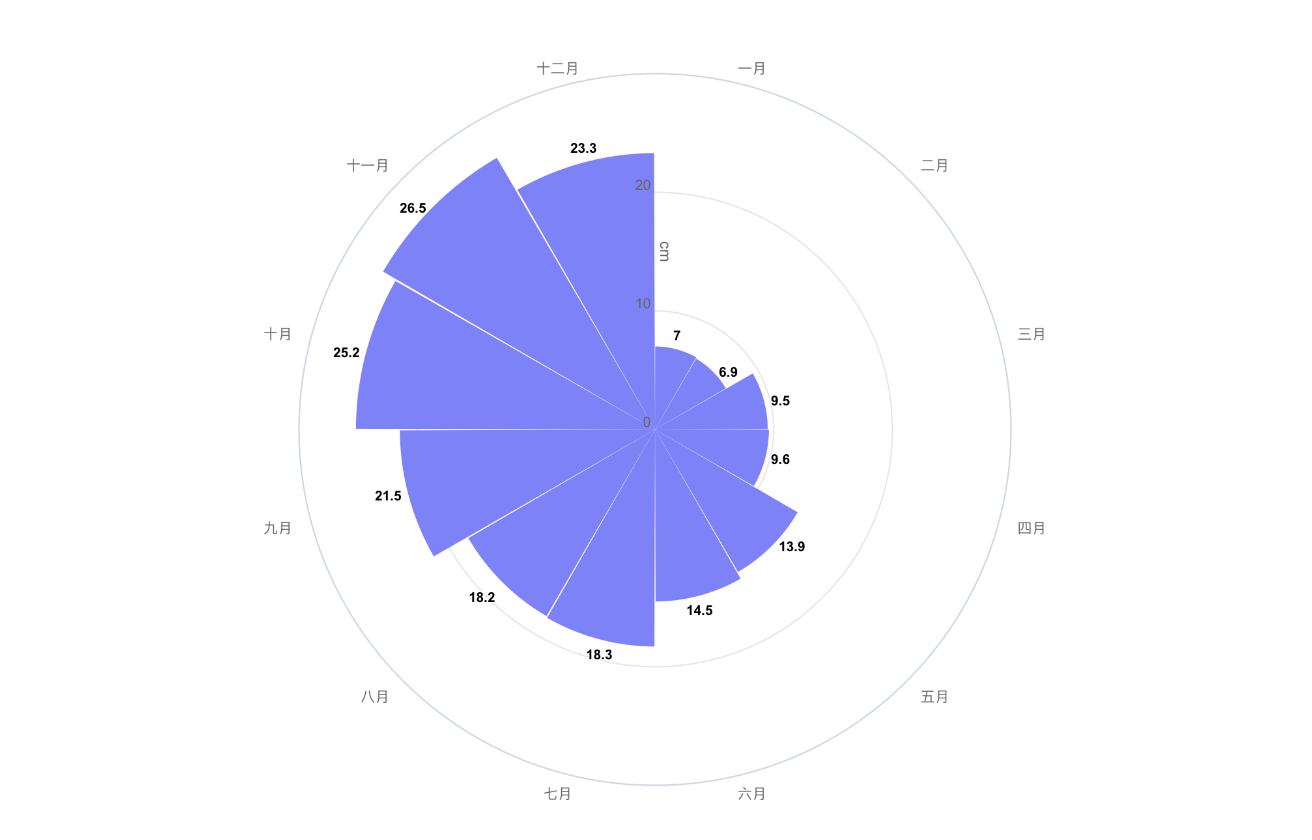
.categories(["Jan", "Feb", "Mar", "Apr", "May", "Jun",
"Jul", "Aug", "Sep", "Oct", "Nov", "Dec"])
.colorsTheme(["#fe117c","#ffc069","#06caf4","#7dffc0"])
.series([
AASeriesElement()
.name("Tokyo")
.data([7.0, 6.9, 9.5, 14.5, 18.2, 21.5, 25.2, 26.5, 23.3, 18.3, 13.9, 9.6]),
AASeriesElement()
.name("New York")
.data([0.2, 0.8, 5.7, 11.3, 17.0, 22.0, 24.8, 24.1, 20.1, 14.1, 8.6, 2.5]),
AASeriesElement()
.name("Berlin")
.data([0.9, 0.6, 3.5, 8.4, 13.5, 17.0, 18.6, 17.9, 14.3, 9.0, 3.9, 1.0]),
AASeriesElement()
.name("London")
.data([3.9, 4.2, 5.7, 8.5, 11.9, 15.2, 17.0, 16.6, 14.2, 10.3, 6.6, 4.8]),
])- Draw the chart(This method is called only for the first time after you create an AAChartView instance object)
        //The chart view object calls the instance object of AAChartModel and draws the final graphic
        aaChartView?.aa_drawChartWithChartModel(aaChartModel!)
🌹🌹🌹Congratulations! Everything was done!!! You will get what you want!!!
if you want to refresh chart content,you should do something as follow.According to your actual needs, select the function that fits you.
- Only refresh the chart data(This method is recommended to be called for updating the series data dynamically)
        //Only refresh the chart series data
aaChartView?.aa_onlyRefreshTheChartDataWithChartModelSeries(chartModelSeriesArray)- Refresh the chart, minus the chart data (this method is recommended for subsequent refreshes after the first drawing of graphics has completed. If you want to update the chart data only, you should use the function
aa_onlyRefreshTheChartDataWithChartModelSeries)
        //Refresh the chart after the AAChartModel whole content is updated
        aaChartView?.aa_refreshChartWholeContentWithChartModel(aaChartModel!)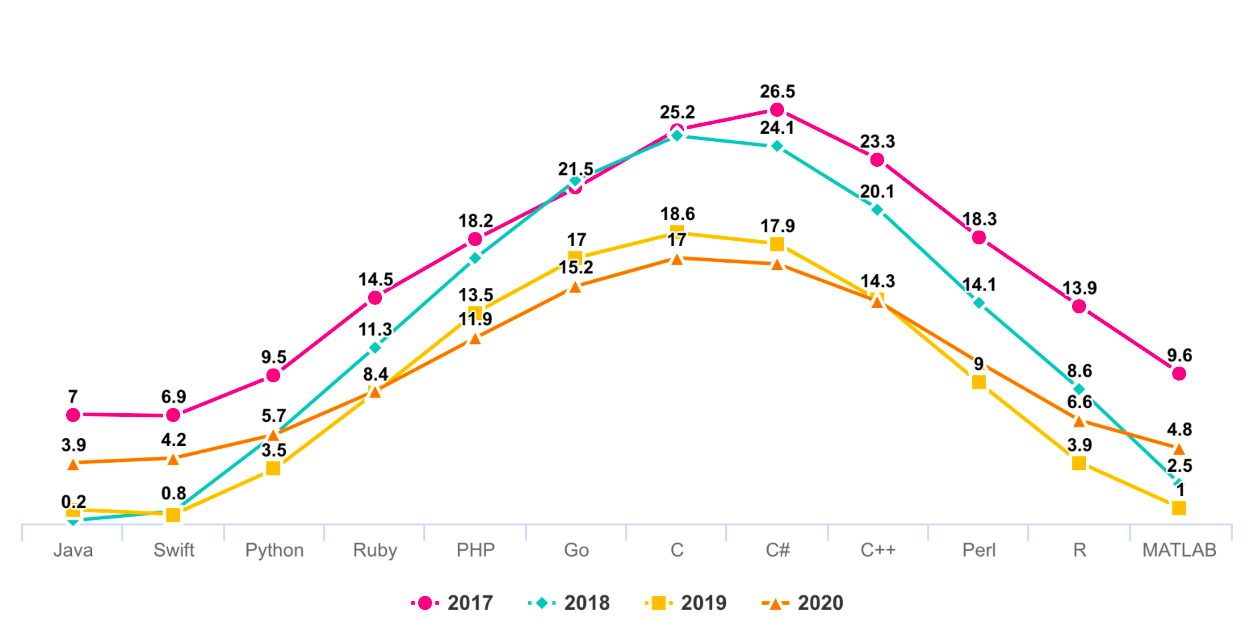
- Note: The following
DEMO pictureis aGIF dynamic picturewhich has a size of around 6M. If you don't see any dynamic preview, then this is because the picture resources were not fully loaded. In such a case please be patient and wait for the contents to finish loading. Maybe you need to reload this page.
you can monitor the user cick or finger move over events message through implementing delegate function for AAChartView instance object
 //Set AAChartView events delegate
 aaChartView!.delegate = self as AAChartViewDelegate


 //implement AAChartView user click or finger move over events delegate function
extension BasicChartVC: AAChartViewDelegate {
    open func aaChartView(_ aaChartView: AAChartView, clickEventMessage: AAClickEventMessageModel) {
        print(
            """

            clicked point series element name: \(clickEventMessage.name ?? "")
            🖱🖱🖱WARNING!!!!!!!!!!!!!!!!!!!! Click Event Message !!!!!!!!!!!!!!!!!!!! WARNING🖱🖱🖱
            ==========================================================================================
            ------------------------------------------------------------------------------------------
            user finger moved over!!!,get the move over event message: {
            category = \(String(describing: clickEventMessage.category))
            index = \(String(describing: clickEventMessage.index))
            name = \(String(describing: clickEventMessage.name))
            offset = \(String(describing: clickEventMessage.offset))
            x = \(String(describing: clickEventMessage.x))
            y = \(String(describing: clickEventMessage.y))
            }
            +++++++++++++++++++++++++++++++++++++++++++++++++++++++++++++++++++++++++++++++++++++++++++


            """
        )
    }

    open func aaChartView(_ aaChartView: AAChartView, moveOverEventMessage: AAMoveOverEventMessageModel) {
        print(
            """

            moved over point series element name: \(moveOverEventMessage.name ?? "")
            ✋🏻✋🏻✋🏻✋🏻✋🏻WARNING!!!!!!!!!!!!!! Move Over Event Message !!!!!!!!!!!!!! WARNING✋🏻✋🏻✋🏻✋🏻✋🏻
            ==========================================================================================
            ------------------------------------------------------------------------------------------
            user finger moved over!!!,get the move over event message: {
            category = \(String(describing: moveOverEventMessage.category))
            index = \(String(describing: moveOverEventMessage.index))
            name = \(String(describing: moveOverEventMessage.name))
            offset = \(String(describing: moveOverEventMessage.offset))
            x = \(String(describing: moveOverEventMessage.x))
            y = \(String(describing: moveOverEventMessage.y))
            }
            +++++++++++++++++++++++++++++++++++++++++++++++++++++++++++++++++++++++++++++++++++++++++++


            """
        )
    }
}
The received user click or finger move over events contain following content
public class AAEventMessageModel: NSObject {
public var name: String?
public var x: Float?
public var y: Float?
public var category: String?
public var offset: [String: Any]?
public var index: Int?
}
public class AAClickEventMessageModel: AAEventMessageModel {}
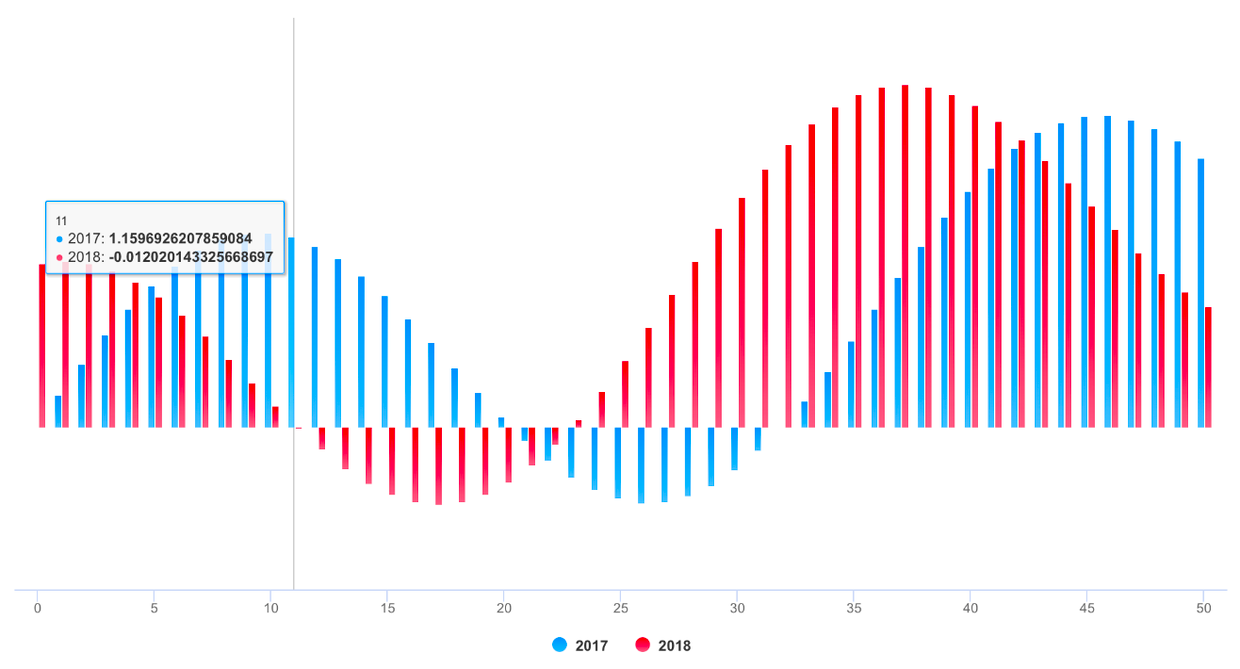
public class AAMoveOverEventMessageModel: AAEventMessageModel {}Monitoring user click events can achieve a variety of custom functions. For example, you can implement Double Charts Linkage through user click event callbacks. The example effects are as follows
As we all know, AAInfographics support using HTML String. Most of time, the headerFormat 、pointFormat、footerFormat HTML string is enough for customizing chart tooltip string content, However, sometimes the needs of APP is so weird to satified, in this time, you can even customize the chart tooltip style through JavaScript function.
For example
- configuring AATooltip instance object properties as follow:
aaOptions.tooltip?
.useHTML(true)
.formatter("""
function () {
return ' 🌕 🌖 🌗 🌘 🌑 🌒 🌓 🌔 <br/> '
+ ' Support JavaScript Function Just Right Now !!! <br/> '
+ ' The Gold Price For <b>2020 '
+ this.x
+ ' </b> Is <b> '
+ this.y
+ ' </b> Dollars ';
}
""")
.valueDecimals(2)//设置取值精确到小数点后几位//设置取值精确到小数点后几位
.backgroundColor("#000000")
.borderColor("#000000")
.style(AAStyle()
.color("#FFD700")
.fontSize(12)
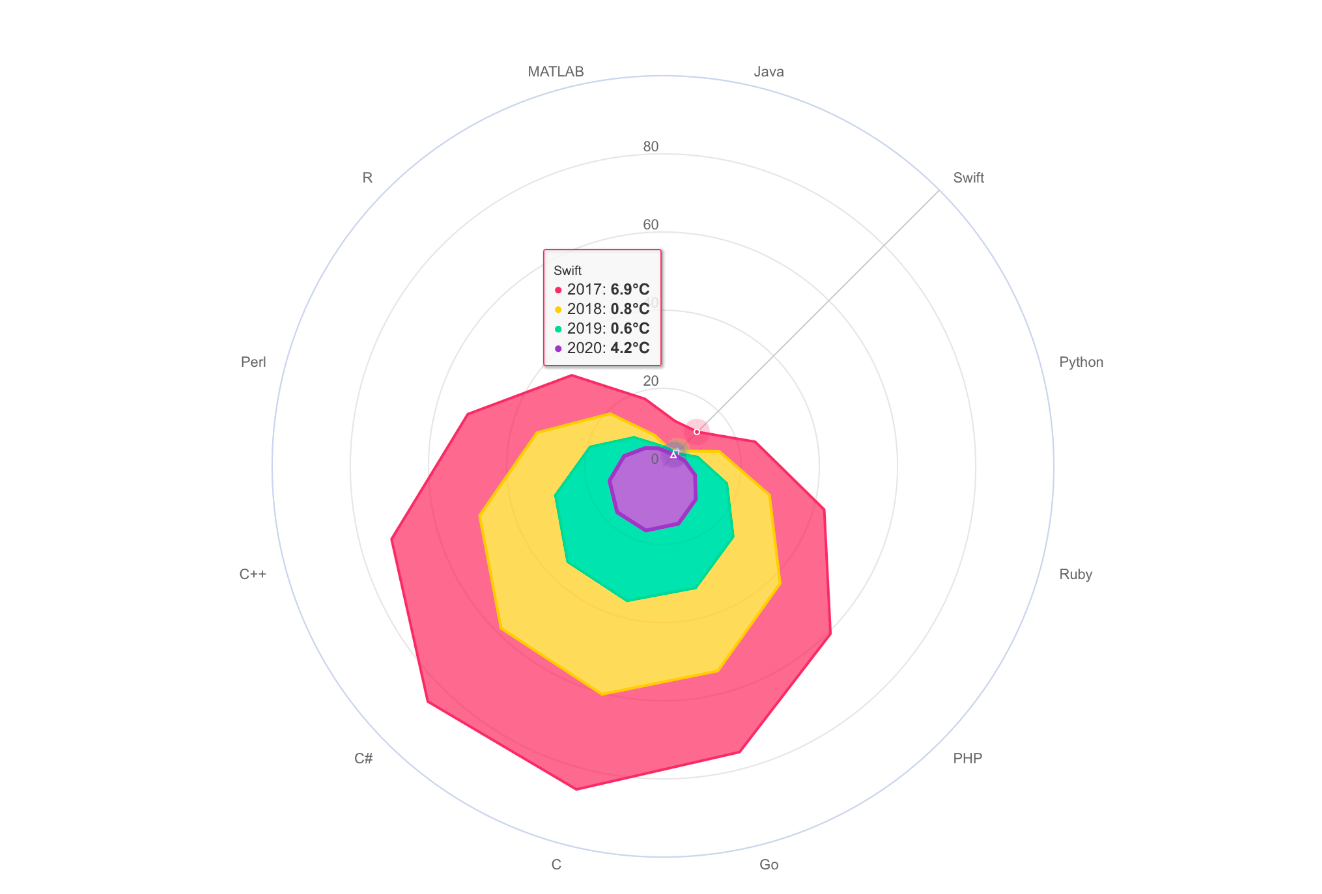
)you can get the customized tooltip style chart like this👇

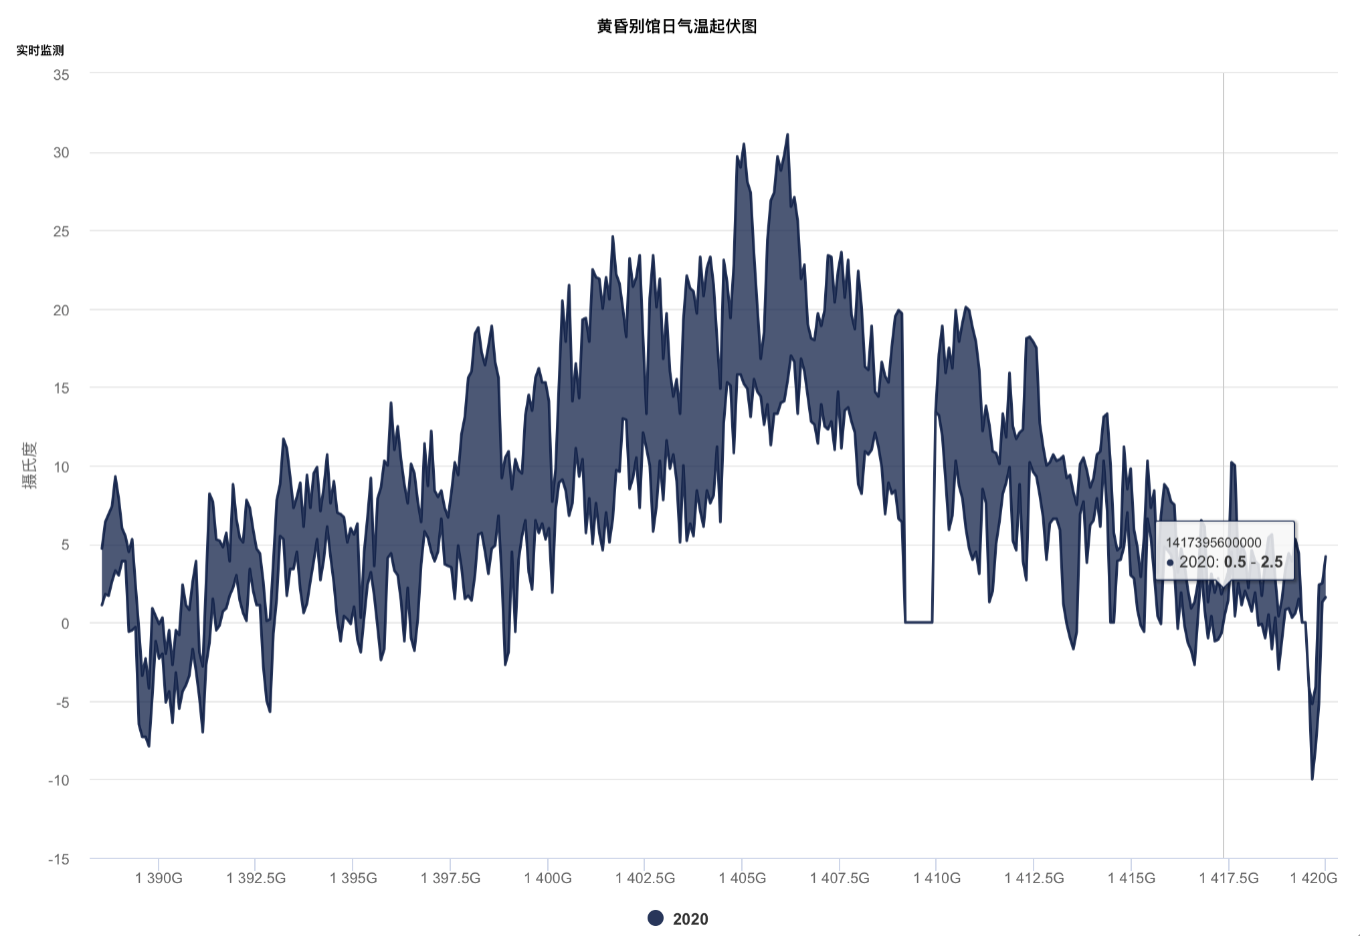
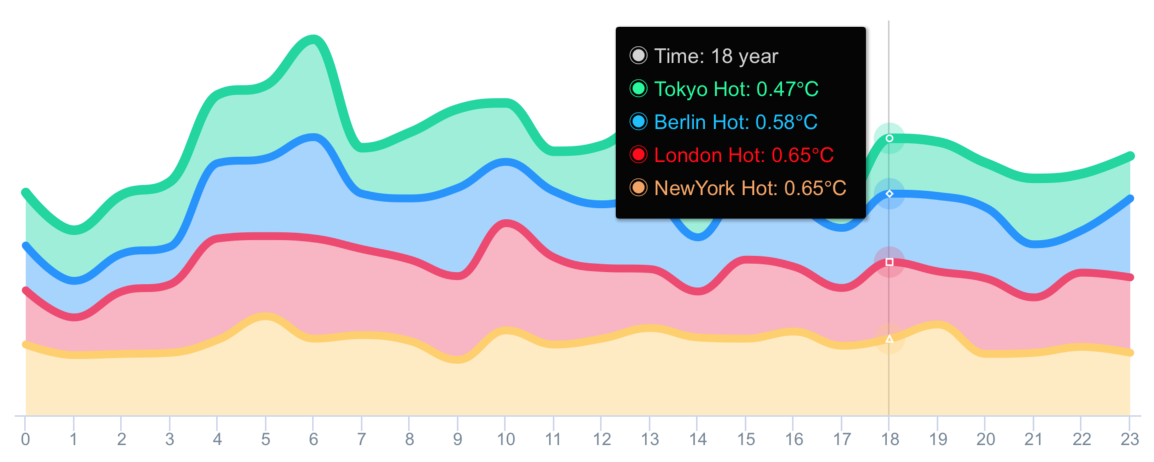
- configuring AATooltip instance object properties as follow:
aaOptions.tooltip?
.useHTML(true)
.formatter(#"""
function () {
let wholeContentStr ='<span style=\"' + 'color:lightGray; font-size:13px\"' + '>◉ Time: ' + this.x + ' year</span><br/>';
let length = this.points.length;
for (let i = 0; i < length; i++) {
let thisPoint = this.points[i];
let yValue = thisPoint.y;
if (yValue != 0) {
let spanStyleStartStr = '<span style=\"' + 'color:'+ thisPoint.color + '; font-size:13px\"' + '>◉ ';
let spanStyleEndStr = '</span> <br/>';
wholeContentStr += spanStyleStartStr + thisPoint.series.name + ': ' + thisPoint.y + '℃' + spanStyleEndStr;
}
}
return wholeContentStr;
}
"""#)
.backgroundColor("#050505")
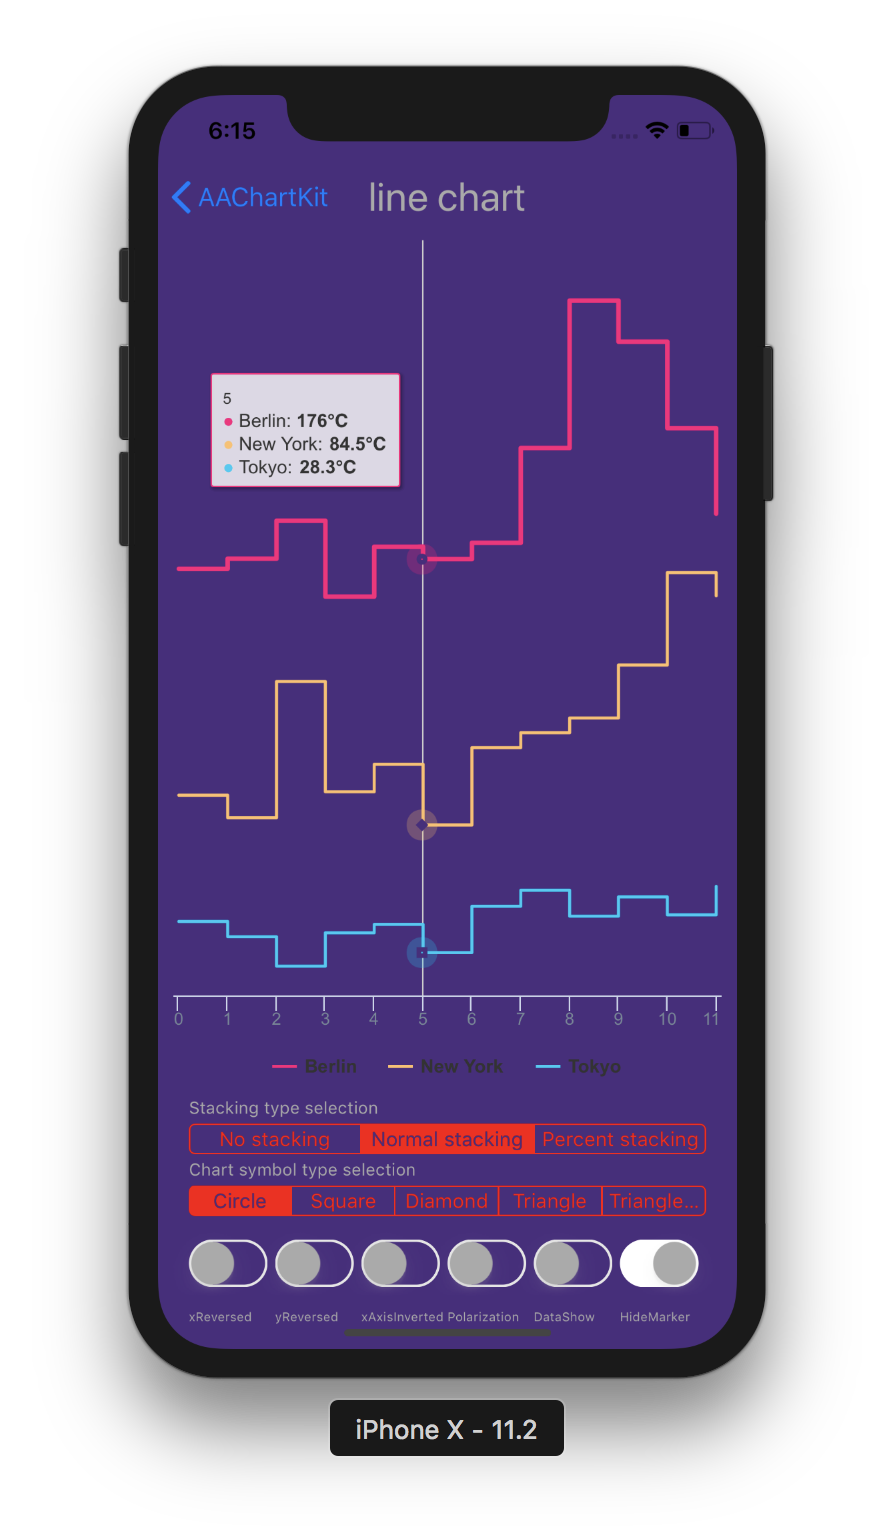
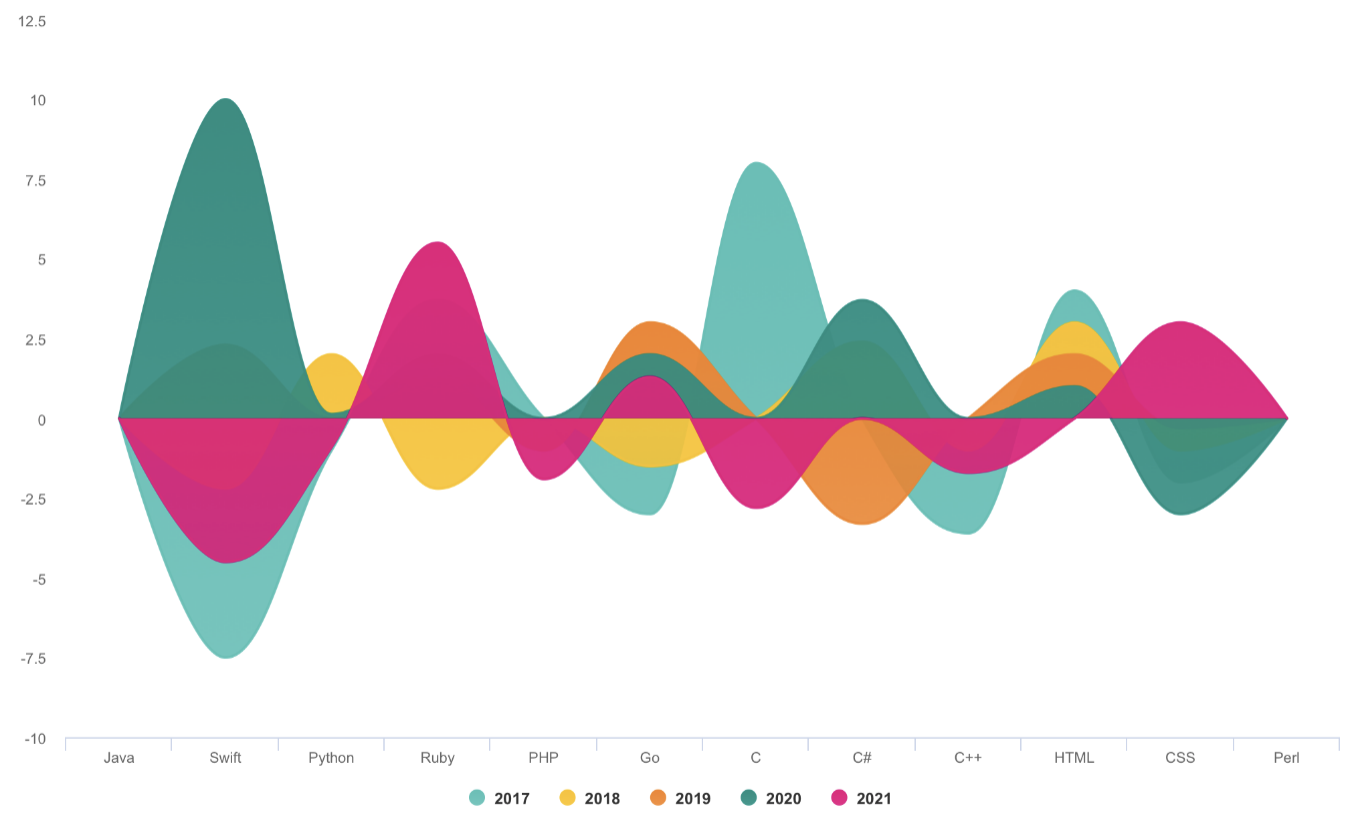
.borderColor("#050505")you can get the customized tooltip style chart like this👇
-
chart with value range segmentation
bands 🎀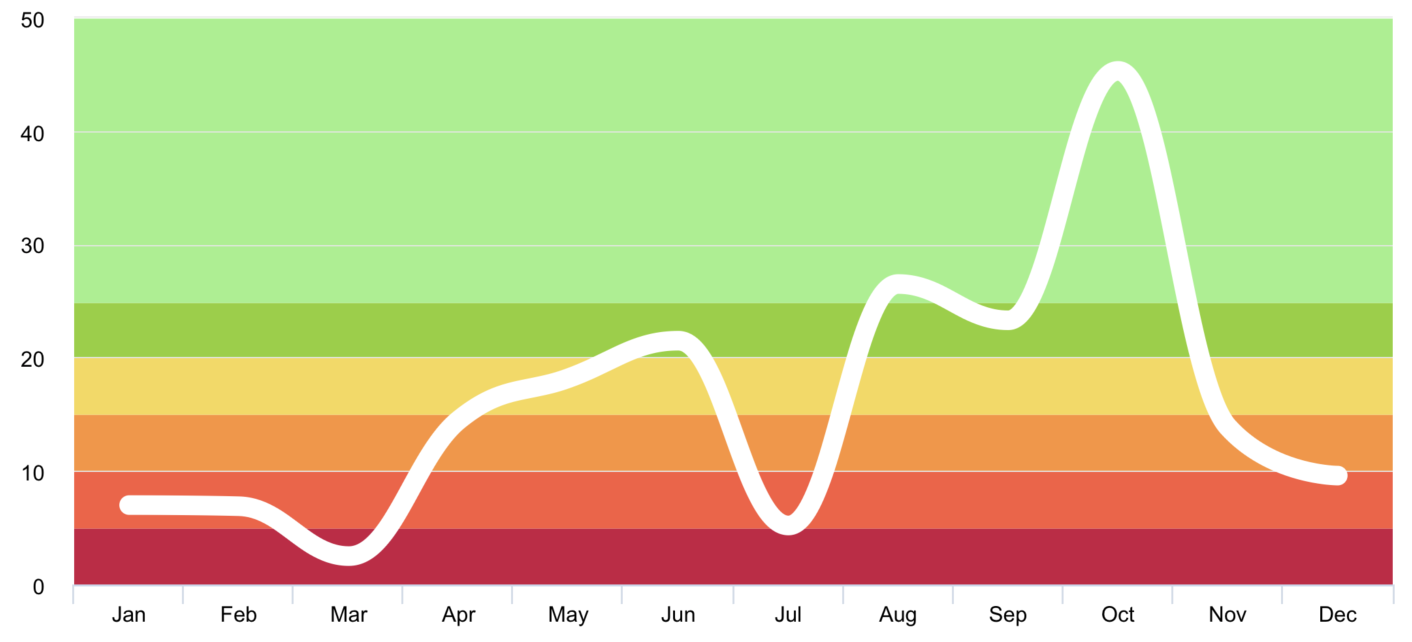
-
chart with value range segmentation
lines 🧶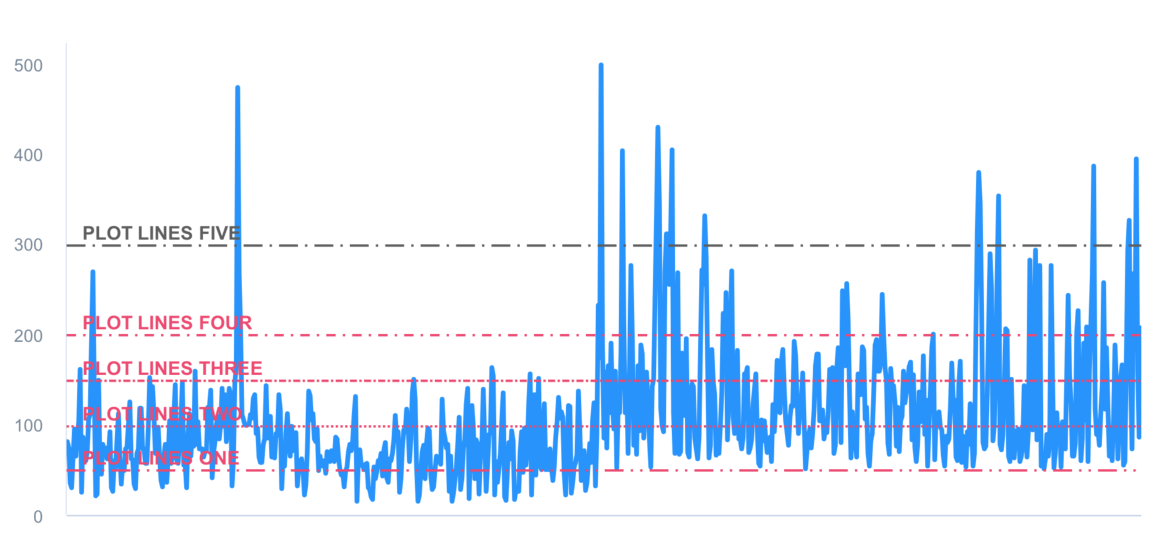
-
chart with value range segmentation
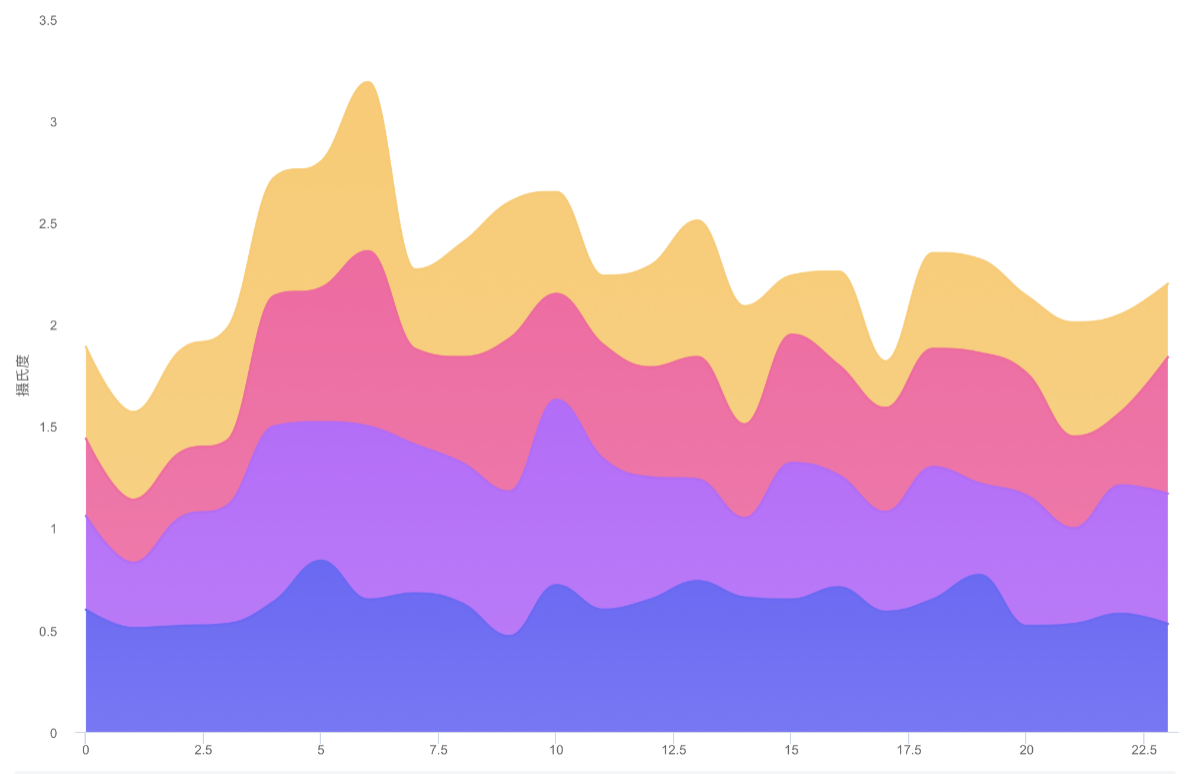
zones 🧱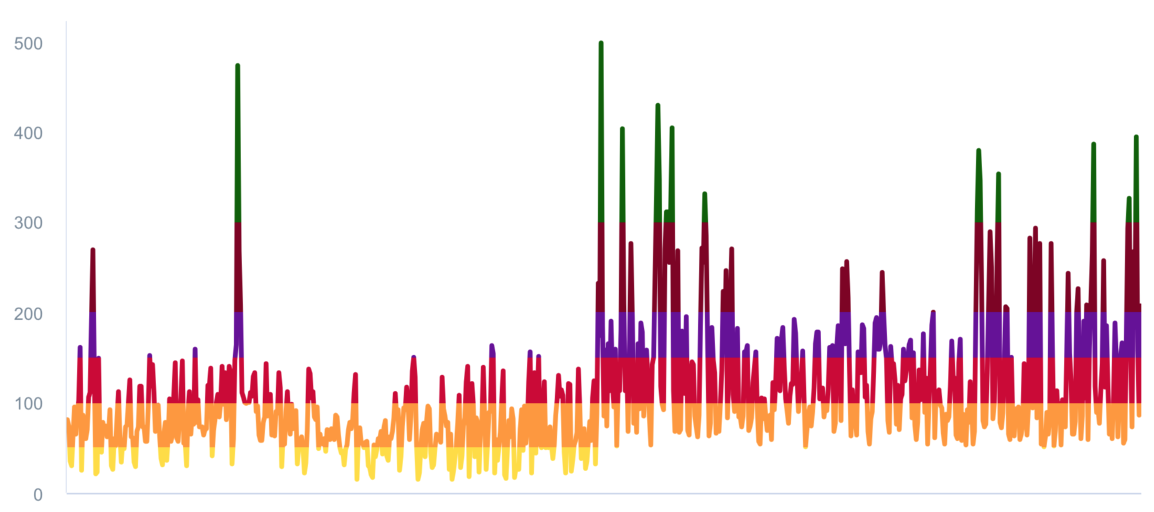
public enum AAChartType: String {
    case column          //Column series display one column per value along an X axis.
    case bar             //A bar series is a special type of column series where the columns are horizontal.
    case area            //The area series type.
    case areaspline      //The area spline series is an area series where the graph between the points is smoothed into a spline.
    case line            //A line series displays information as a series of data points connected by straight line segments.
    case spline          //A spline series is a special type of line series, where the segments between the data points are smoothed.
    case scatter         //A scatter plot uses cartesian coordinates to display values for two variables for a set of data.
    case pie             //A pie chart is a circular graphic which is divided into slices to illustrate numerical proportion.
    case bubble          //A bubble series is a three dimensional series type where each point renders an X, Y and Z value. Each points is drawn as a bubble where the position along the X and Y axes mark the X and Y values, and the size of the bubble relates to the Z value.
    case packedbubble    //A packed bubble series is a two dimensional series type, where each point renders a value in X, Y position. Each point is drawn as a bubble where the bubbles don't overlap with each other and the radius of the bubble relates to the value.
    case pyramid         //A pyramid series is a special type of funnel, without neck and reversed by default.
    case funnel          //Funnel charts are a type of chart often used to visualize stages in a sales project, where the top are the initial stages with the most clients. It requires that the modules/funnel.js file is loaded.
    case columnpyramid   //Column pyramid series display one pyramid per value along an X axis. To display horizontal pyramids, set chart.inverted to true.
    case columnrange     //The column range is a cartesian series type with higher and lower Y values along an X axis. To display horizontal bars, set chart.inverted to true.
    case arearange       //The area range series is a cartesian series with higher and lower values for each point along an X axis, where the area between the values is shaded.
    case areasplinerange //The area spline range is a cartesian series type with higher and lower Y values along an X axis. The area inside the range is colored, and the graph outlining the area is a smoothed spline.
    case boxplot         //A box plot is a convenient way of depicting groups of data through their five-number summaries: the smallest observation (sample minimum), lower quartile (Q1), median (Q2), upper quartile (Q3), and largest observation (sample maximum).
    case waterfall       //A waterfall chart displays sequentially introduced positive or negative values in cumulative columns.
    case polygon         //A polygon series can be used to draw any freeform shape in the cartesian coordinate system. A fill is applied with the color option, and stroke is applied through lineWidth and lineColor options.
    case gauge           //Gauges are circular plots displaying one or more values with a dial pointing to values along the perimeter.
    case errorbar        //Error bars are a graphical representation of the variability of data and are used on graphs to indicate the error, or uncertainty in a reported measurement.
}enum AAChartZoomType: String {
case none = "none"
case x = "x"
case y = "y"
case xy = "xy"
}public enum AAChartLineDashStyleType: String {
case solid //———————————————————————————————————
case shortDash //— — — — — — — — — — — — — — — — — —
case shortDot //ⵈⵈⵈⵈⵈⵈⵈⵈⵈⵈⵈⵈⵈⵈⵈⵈⵈⵈⵈⵈⵈⵈⵈⵈⵈⵈⵈⵈ
case shortDashDot //—‧—‧—‧—‧—‧—‧—‧—‧—‧—‧—‧—‧—‧—‧—‧—‧—‧—‧
case shortDashDotDot //—‧‧—‧‧—‧‧—‧‧—‧‧—‧‧—‧‧—‧‧—‧‧—‧‧—‧‧—‧‧
case dot //‧‧‧‧‧‧‧‧‧‧‧‧‧‧‧‧‧‧‧‧‧‧‧‧‧‧‧‧‧‧‧‧‧‧‧
case dash //—— —— —— —— —— —— —— —— —— —— —— ——
case longDash //——— ——— ——— ——— ——— ——— ——— ——— ———
case dashDot //——‧——‧——‧——‧——‧——‧——‧——‧——‧——‧——‧——‧
case longDashDot //———‧———‧———‧———‧———‧———‧———‧———‧———‧
case longDashDotDot //———‧‧———‧‧———‧‧———‧‧———‧‧———‧‧———‧‧
} public enum AAChartAnimationType: String {
case easeInQuad = "easeInQuad"
case easeOutQuad = "easeOutQuad"
case easeInOutQuad = "easeInOutQuad"
case easeInCubic = "easeInCubic"
case easeOutCubic = "easeOutCubic"
case easeInOutCubic = "easeInOutCubic"
case easeInQuart = "easeInQuart"
case easeOutQuart = "easeOutQuart"
case easeInOutQuart = "easeInOutQuart"
case easeInQuint = "easeInQuint"
case easeOutQuint = "easeOutQuint"
case easeInOutQuint = "easeInOutQuint"
case easeInSine = "easeInSine"
case easeOutSine = "easeOutSine"
case easeInOutSine = "easeInOutSine"
case easeInExpo = "easeInExpo"
case easeOutExpo = "easeOutExpo"
case easeInOutExpo = "easeInOutExpo"
case easeInCirc = "easeInCirc"
case easeOutCirc = "easeOutCirc"
case easeInOutCirc = "easeInOutCirc"
case easeOutBounce = "easeOutBounce"
case easeInBack = "easeInBack"
case easeOutBack = "easeOutBack"
case easeInOutBack = "easeInOutBack"
case elastic = "elastic"
case swingFromTo = "swingFromTo"
case swingFrom = "swingFrom"
case swingTo = "swingTo"
case bounce = "bounce"
case bouncePast = "bouncePast"
case easeFromTo = "easeFromTo"
case easeFrom = "easeFrom"
case easeTo = "easeTo"
}Here are the ten concrete animation types of AAInfographics
| Back | Bounce | Circ | Cubic | Elastic |
|---|---|---|---|---|
 |
 |
 |
 |
 |
| Expo | Quad | Quart | Quint | Sine |
|---|---|---|---|---|
 |
 |
 |
 |
 |
| Property name | Property type | Description | Value Range |
|---|---|---|---|
| title | String | The chart title | Any valid string |
| subtitle | String | The chart subtitle | Any valid string |
| chartType | AAChartType | The default series type for the chart. Can be any of the chart types listed under AAChartType. |
.column, .bar, .area, .areaSpline, .line, .spline, .pie, .bubble, .scatter, .pyramid, .funnel, .areaRange, .columnRange |
| stacking | AAChartStackingType | Whether to stack the values of each series on top of each other. Possible values are null to disable, "normal" to stack by value or "percent". When stacking is enabled, data must be sorted in ascending X order | .none, .normal, .percent |
| symbol | AAChartSymbolType | A predefined shape or symbol for the marker. When null, the symbol is pulled from options.symbols. Other possible values are "circle", "square", "diamond", "triangle" and "triangle-down" | .circle, .square, .diamond, .triangle, .triangleDown |
public class AAChartModel: AAObject {
    public var animationType: AAChartAnimationType? //The type of chart animation
    public var animationDuration: Int?      //The chart rendering animation duration
    public var title: String?               //The chart title
    public var titleStyle: AAStyle?         //The chart title style
    public var subtitle: String?            //The chart subtitle
    public var subtitleAlign: AAChartAlignType?//The chart subtitle text align style
    public var subtitleStyle: AAStyle?      //The chart subtitle style
    public var chartType: AAChartType?      //The default series type for the chart. Can be any of the chart types listed under `AAChartType`. Defaults to line
    public var stacking: AAChartStackingType? //Whether to stack the values of each series on top of each other. Possible values are null to disable, "normal" to stack by value or "percent". When stacking is enabled, data must be sorted in ascending X order
    public var markerSymbol: AAChartSymbolType?   //A predefined shape or symbol for the marker. When null, the symbol is pulled from options.symbols. Other possible values are "circle", "square", "diamond", "triangle" and "triangle-down"
    public var markerSymbolStyle: AAChartSymbolStyleType?
    public var zoomType: AAChartZoomType?   //Decides in what dimensions the user can zoom by dragging the mouse. Can be one of x, y or xy
    public var inverted: Bool?              //Whether to invert the axes so that the x axis is vertical and y axis is horizontal. When true, the x axis is reversed by default. If a bar series is present in the chart, it will be inverted automatically.Inverting the chart doesn't have an effect if there are no cartesian series in the chart, or if the chart is polar.Defaults to false
    public var xAxisReversed: Bool?         //Whether to reverse the axis so that the highest number is closest to the origin. If the chart is inverted, the x axis is reversed by default. Defaults to false
    public var yAxisReversed: Bool?         //Whether to reverse the axis so that the highest number is closest to the origin. If the chart is inverted, the x axis is reversed by default. Defaults to false
    public var polar: Bool?                 //When true, cartesian charts like line, spline, area and column are transformed into the polar coordinate system. Requires `AAHighchartsMore.js`. Defaults to false
    public var margin: [Any?]?
    public var dataLabelsEnabled: Bool?     //Enable or disable the data labels. Defaults to false
    public var dataLabelsStyle: AAStyle?    //The data labels style
    public var xAxisLabelsEnabled: Bool?    //Enable or disable the axis labels. Defaults to true
    public var xAxisLabelsStyle: AAStyle?   //The x axis labels style
    public var categories: [String]?        //Set new categories for the axis
    public var xAxisGridLineWidth: Float?   //The width of the grid lines extending the ticks across the plot area.Defaults to 0
    public var xAxisVisible: Bool?          //Show the x axis or not
    public var xAxisTickInterval: Float?    //Custom x axis tick interval,It is useful when the x categories array is too long to show all of them
    public var yAxisVisible: Bool?          //Show the y axis or not
    public var yAxisLabelsEnabled: Bool?    //Enable or disable the axis labels. Defaults to true
    public var yAxisLabelsStyle: AAStyle?   //The y axis labels style
    public var yAxisTitle: String?          //The actual text of the axis title
    public var xAxisTitle: String?          //The actual text of the axis title
    public var yAxisLineWidth: Float?       //The width of y axis line
    public var yAxisGridLineWidth: Float?   //The width of the grid lines extending the ticks across the plot area. Defaults to 1
    public var yAxisMin: Double?            //The y axis mini value
    public var yAxisMax: Double?            //The y axis max value
    public var yAxisTickPositions:[Any]?    //An array defining where the ticks are laid out on the axis. This overrides the default behaviour of tickPixelInterval and tickInterval.
    public var yAxisAllowDecimals: Bool?    //The y axis values label allow decimals or not
    public var tooltipEnabled: Bool?        //Show the tooltip or not
    public var tooltipValueSuffix: String?  //Custom tooltip value unit suffix
    public var colorsTheme: [Any]?          //An array containing the default colors for the chart's series. When all colors are used, new colors are pulled from the start again. Defaults to: ["#bb250c","#f67210","#fde680","#257679","#f1c6c5"]
    public var series: [Any]?               //An array of all the chart's series
    public var legendEnabled: Bool?         //Enable or disable the legend. Defaults to true
    public var backgroundColor: Any?        //The background color or gradient for the outer chart area. Defaults to #FFFFFF
    public var borderRadius: Float?         //The corner radius of the outer chart border. Defaults to 0
    public var markerRadius: Float?         //The radius of the point marker. Defaults to 4
    public var scrollablePlotArea: AAScrollablePlotArea?    //Scroll properties if supported

    ...
    ...
}
 "CODE IS FAR AWAY FROM BUG WITH THE ANIMAL PROTECTING"

 *          ##2      ##2
 *       ┏-##1   ┏-##1
 *    ┏_┛ ┻---━┛_┻━━┓
 *    ┃           ┃
 *    ┃   ━       ┃
 *    ┃ @^   @^    ┃
 *    ┃        ┃
 *    ┃   ┻    ┃
 *    ┃_      _┃
 *     ┗━┓   ┏━┛
 *      ┃   ┃神兽保佑
 *      ┃   ┃永无BUG!
 *      ┃   ┗━━━┓----|
 *      ┃         ┣┓}}}
 *      ┃         ┏┛
 *      ┗┓&&&┓-┏&&&┓┏┛-|
 *       ┃┫┫  ┃┫┫
 *       ┗┻┛  ┗┻┛
 *
 *
"CODE IS FAR AWAY FROM BUG WITH THE ANIMAL PROTECTING"| Language | Project Name | Target Platform | Source Code Link |
|---|---|---|---|
| Swift | AAInfographics | iOS | https://github.com/AAChartModel/AAChartKit-Swift |
| Objective C | AAChartKit | iOS | https://github.com/AAChartModel/AAChartKit |
| Kotlin | AAInfographics | Android | https://github.com/AAChartModel/AAChartCore-Kotlin |
| Java | AAChartCore | Android | https://github.com/AAChartModel/AAChartCore |
Pro Versions are more powerful data visualization frameworks that support more types beautiful chart like bellcurve, bullet, columnpyramid, cylinder, dependencywheel, heatmap, histogram, networkgraph, organization, packedbubble, pareto, sankey, series, solidgauge, streamgraph, sunburst, tilemap, timeline, treemap, variablepie, variwide, vector, venn, windbarb, wordcloud, xrange charts and so on.
| Language | Project Name | Target Platform | Source Code Link |
|---|---|---|---|
| Swift | AAInfographics-Pro | iOS | https://github.com/AAChartModel/AAChartKit-Swift-Pro |
| Objective C | AAChartKit-Pro | iOS | https://github.com/AAChartModel/AAChartKit-Pro |
| Kotlin | AAInfographics-Pro | Android | Coming Soon... |
| Java | AAChartCore-Pro | Android | Coming Soon... |
AAInfographics is available under the MIT license. See the LICENSE file for more information.
- 🌕 🌖 🌗 🌘 WARM TIPS!!! 🌑 🌒 🌓 🌔
- Please contact me on GitHub,if there are any problems encountered in use.
- GitHub Issues : https://github.com/AAChartModel/AAChartKit-Swift/issues
- And if you want to contribute for this project, please contact me as well
- GitHub : https://github.com/AAChartModel
- StackOverflow : https://stackoverflow.com/users/7842508/codeforu
- JianShu : http://www.jianshu.com/u/f1e6753d4254
- SegmentFault : https://segmentfault.com/u/huanghunbieguan
- Support for the user to add delegate events after the graphics content loading was completed
- Support graphics to refresh global content dynamically
- Support graphics to refresh pure data (
series) content dynamically - Support color layer gradient effects
- Support 3D graphics effects, valid only for partial graphics such as
column chart、bar chart、pie charts、scatterplot chart、bubble chart, etc - Support horizontal screen (full screen) effect
- Support setting graphics rendering animation freely
- Support for users to configure
AAOptionsmodel object properties freely - Support stacking the graphics
- Support reversing the graphics axis
- Support rendering the scatter chart
- Support rendering the column range map
- Support rendering the area range graph
- Support rendering the polar chart
- Support rendering the step line chart
- Support rendering the step area chart
- Support rendering the rectangular tree hierarchy diagrams
- Support rendering the circular progress bar chart
- Support adding clicked event callbacks for graphics
- Support adding finger✋🏻 or mouse🖱 move over event callbacks for graphics
- Support graphics to refresh pure data in real time and scroll dynamically
- Support rendered graphics to generate image files
- Support generating image files saved to the system album